



Yorba Linda, California "“ The Land of Gracious Living Nestled in the rolling hills of northeastern Orange County, Yorba Linda lives up to its nickname: The Land of Gracious Living. This affluent, well-planned city offers a peaceful suburban lifestyle with exceptional amenities, making it one of Southern California's most desirable places to call home. Why Yorba Linda is a Top Choice: 1. Top-Tier Schools: Yorba Linda is served by the Placentia-Yorba Linda Unified School District (PYLUSD), known for its high-performing schools and robust academic programs. It's a major draw for families prioritizing education. 2. Safe & Family-Friendly: Consistently ranked among the safest cities in California, Yorba Linda offers a strong sense of community, low crime, and meticulously maintained neighborhoods. 3. Parks & Outdoor Living: With over 100 miles of equestrian, biking, and hiking trails, along with numerous parks and open spaces, Yorba Linda is a haven for nature lovers and outdoor enthusiasts. 4. Historic & Cultural Sites: Home to the Richard Nixon Presidential Library and Museum, Yorba Linda has rich historical roots and offers engaging cultural experiences for residents and visitors alike. 5. Upscale Living: The city features beautiful master-planned communities, luxury estates, and scenic hillside homes with sweeping views. Shopping and dining are elevated with areas like the Yorba Linda Town Center, which blends modern amenities with small-town charm. 6. Ideal Location: Centrally located with easy access to the 91 and 57 freeways, Yorba Linda offers a tranquil residential feel while remaining connected to nearby business hubs, entertainment, and beaches.
Yorba Linda, CA Housing Market & City Data
Explore key insights and real experiences from people who call Yorba Linda home. Use the data below as a starting point to compare and discover what makes this city a great place to live.
Yorba Linda City Reviews
Real experiences from people who call Yorba Linda home.
Housing & Demographic Overview
Key insights about the community
HOUSING DATA (September 2026)
HOUSEHOLD OVERVIEW
EDUCATION, GENDER & MARITAL STATUS
EDUCATION
- No Highschool Degree or GED4.5%
- Highschool Education13.1%
- Some College28.3%
- Bachelors Degree34.4%
- Graduate Degree19.7%
- Total College or Above54.1%
- Stem Degree46.4%
GENDER BREAKDOWN
- Male48.0%
- Female52.0%
MARITAL STATUS
- Married62.4%
- Divorced8.2%
- Never Married24.9%
- Widowed4.5%
CITY DATA & AGE BREAKDOWN
CITY DATA
AGE BREAKDOWN
| Age Group | % of Population |
|---|---|
| Under 18 | 25.2% |
| 19–29 | 10.4% |
| 30–39 | 9.3% |
| 40–49 | 13.5% |
| Age Group | % of Population |
|---|---|
| 50–59 | 16.0% |
| 60–69 | 14.1% |
| 70–79 | 7.8% |
| 80+ | 3.9% |
WORKFORCE, ETHNICITY & OTHER
WORKFORCE
ETHNICITY
OTHER
Local Discussions
Community questions and conversations about living in Yorba Linda, CA.
- Is Yorba Linda, CA a good place to buy a house?0
Local perspectives on Yorba Linda home prices, buyer demand, neighborhoods, and what to consider before buying a home.
- What are the best neighborhoods in Yorba Linda, CA for families?0
Local insights on Yorba Linda neighborhoods, schools, parks, commute times, and other factors families may want to consider.
- What should home buyers know about the Yorba Linda, CA housing market?0
Local insights on Yorba Linda home prices, housing inventory, buyer competition, and current real estate market conditions.
- Is it better to buy or rent a home in Yorba Linda, CA?0
Compare Yorba Linda home prices, rents, monthly housing costs, and other factors that can affect the decision to buy or rent.
- What are the most affordable neighborhoods in Yorba Linda, CA?0
Explore Yorba Linda neighborhoods where home buyers may find more affordable housing options and better value for their budget.
- How much income do you need to buy a house in Yorba Linda, CA?0
Learn how Yorba Linda home prices, down payments, mortgage costs, and other expenses can affect how much income buyers may need.
- How much are property taxes on a home in Yorba Linda, CA?0
Learn how Yorba Linda property taxes are calculated and how they can affect the overall cost of owning a home.
- What are the best neighborhoods in Yorba Linda, CA for first-time home buyers?0
Explore Yorba Linda neighborhoods first-time home buyers may consider based on home prices, location, amenities, and lifestyle.
- What is it like to live in Yorba Linda, CA?0
Local perspectives on Yorba Linda neighborhoods, cost of living, weather, commuting, things to do, and everyday life.
- What should I know before moving to Yorba Linda, CA?0
What newcomers should know about Yorba Linda housing costs, neighborhoods, transportation, weather, and everyday expenses.
Top Real Estate Agents in Yorba Linda, CA


Neighborhoods in Yorba Linda, CA
Get to know neighborhoods in Yorba Linda, ordered by the number of properties in the provider sample.
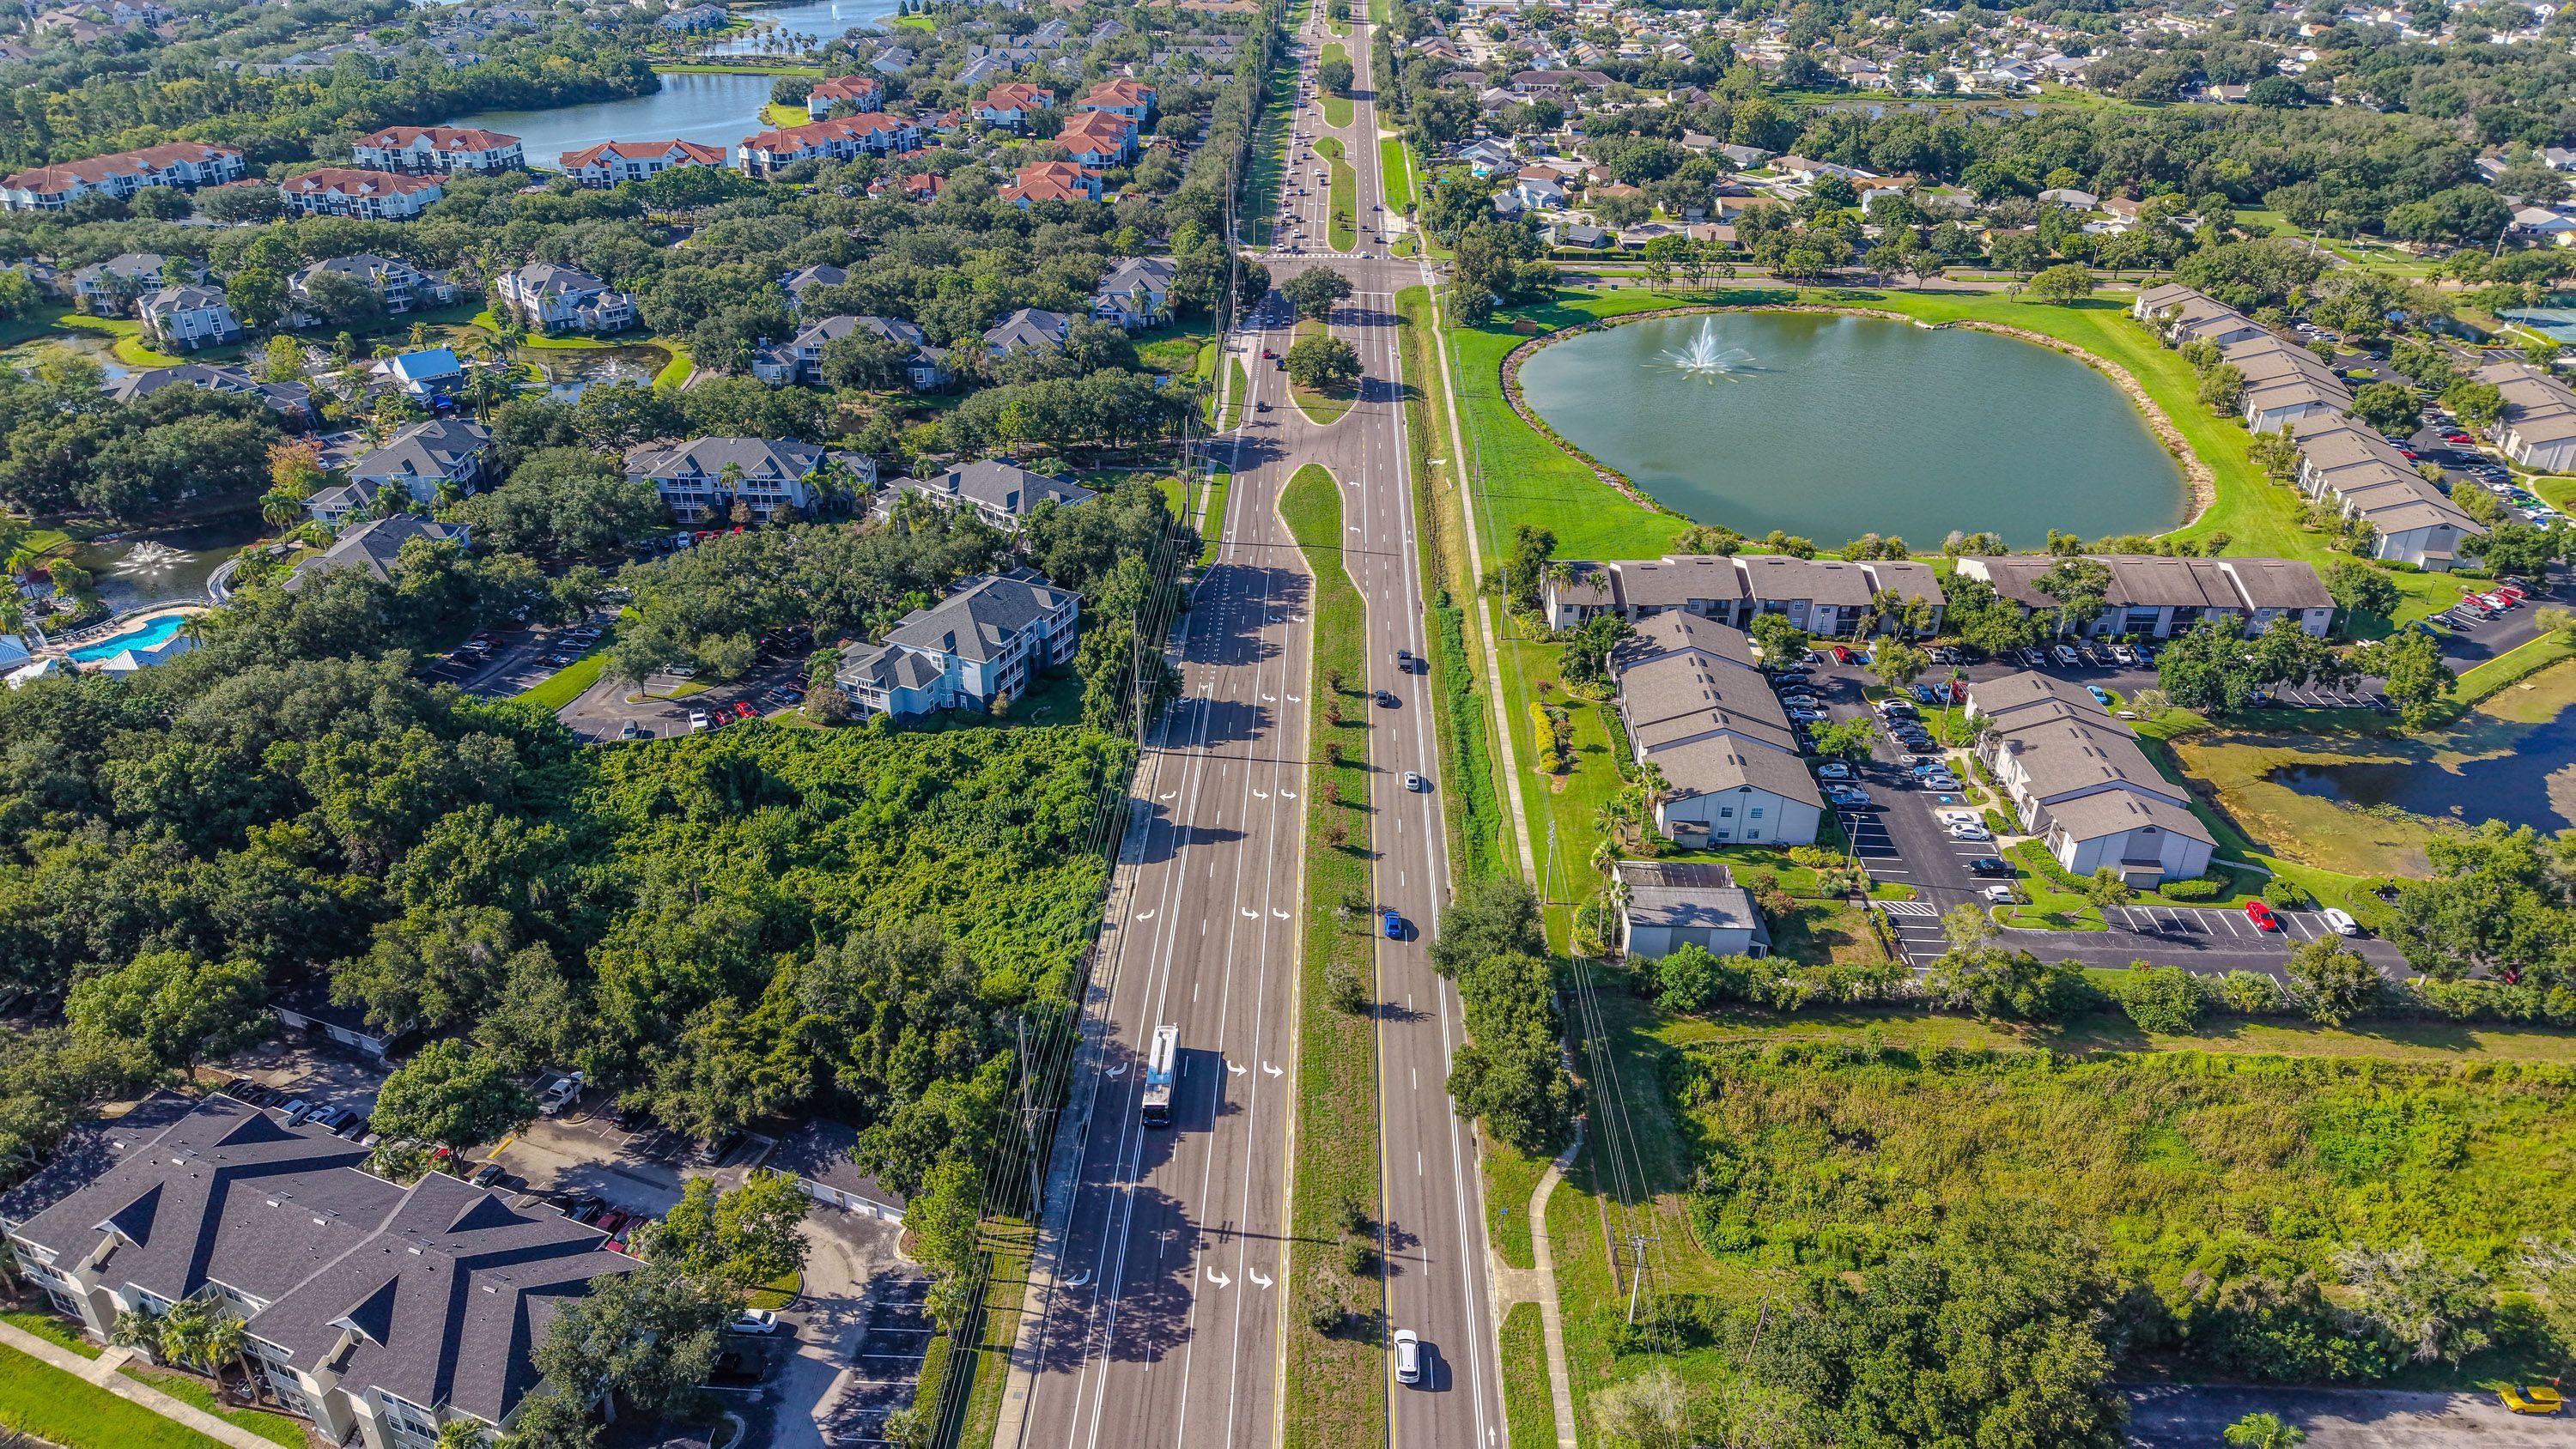
Vista Del Verde ↗
- Median asking price
- $1,298,500
- / sq ft
- $540
- Active listings
- 9
- properties in discovery sample
- 78
ANearby schools · estimated
8.5/10 · 6 schools
East Lake Village ↗
- Median asking price
- $899,900
- / sq ft
- $585
- Active listings
- 6
- properties in discovery sample
- 50
ANearby schools · estimated
8.4/10 · 7 schools
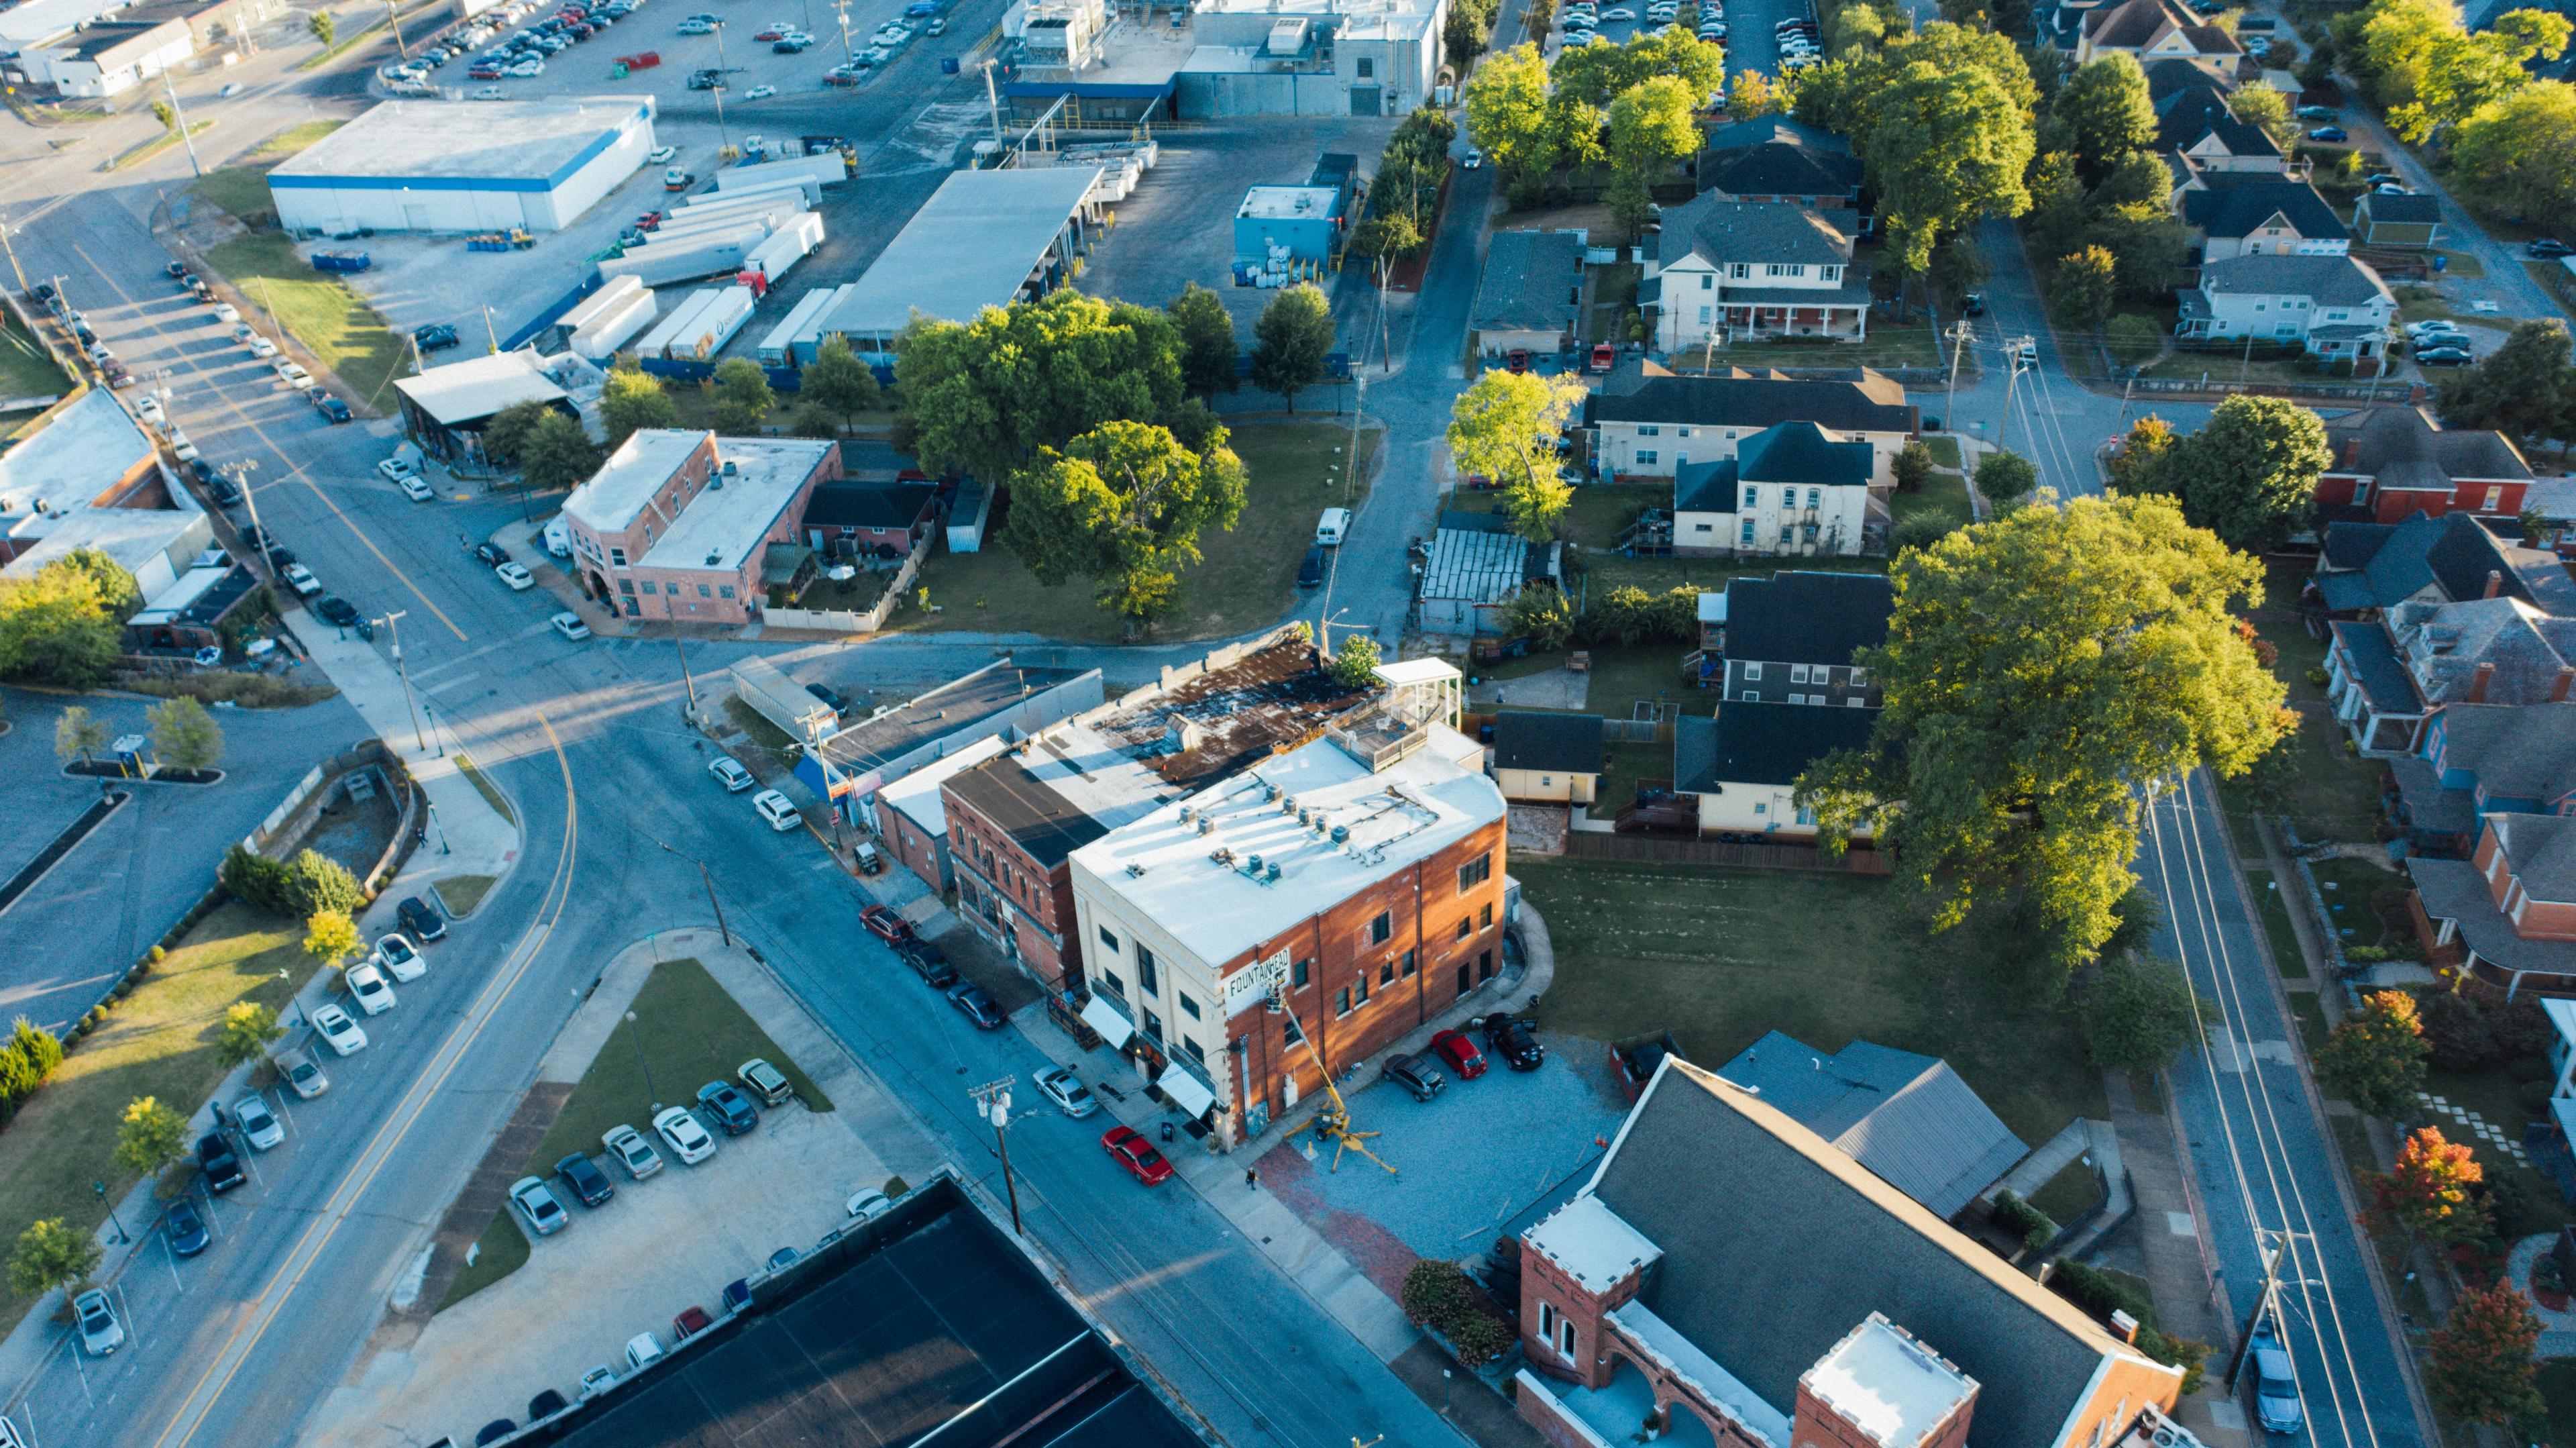
Rancho Dominguez Townhomes ↗
- Median asking price
- $537,450
- / sq ft
- —
- Active listings
- Not available
- properties in discovery sample
- 31
ANearby schools · estimated
8/10 · 2 schools
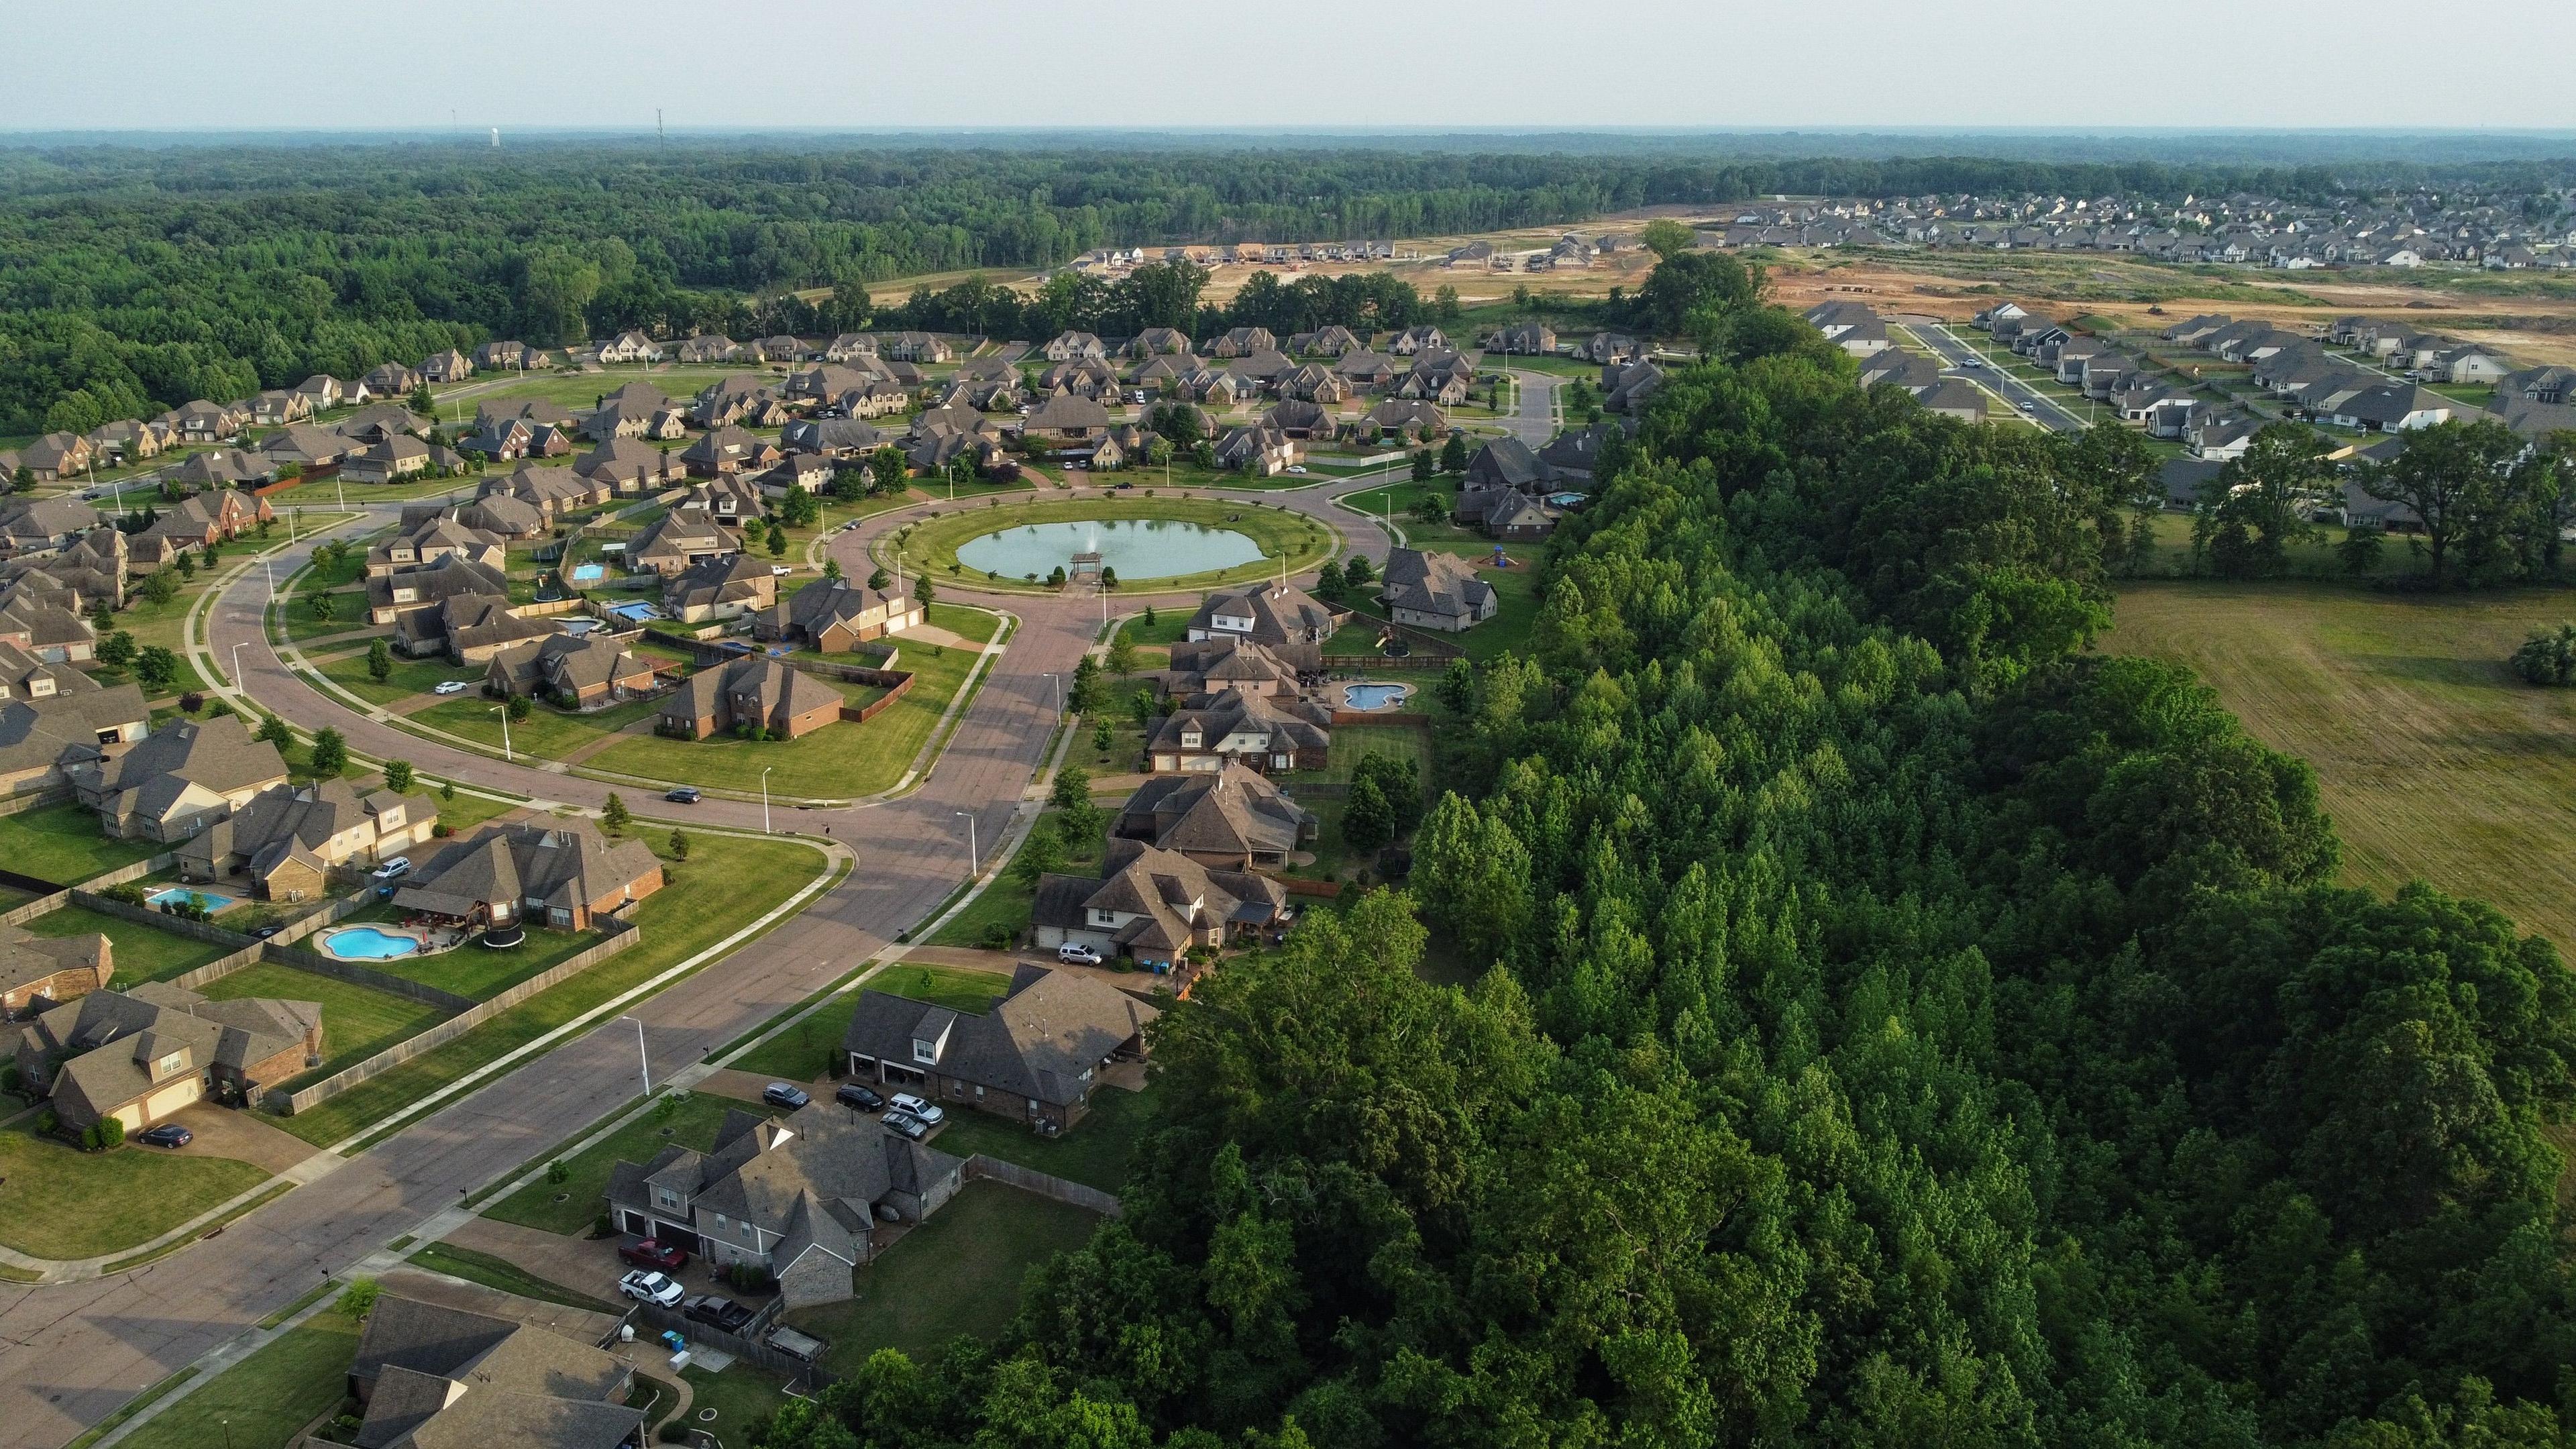
Yorba Linda Knolls ↗
- Median asking price
- $485,000
- / sq ft
- —
- Active listings
- Not available
- properties in discovery sample
- 27
ANearby schools · estimated
9/10 · 3 schools

Woodgate ↗
- Median asking price
- $439,500
- / sq ft
- —
- Active listings
- Not available
- properties in discovery sample
- 26
ANearby schools · estimated
8/10 · 3 schools
Data as of . Listing snapshots from Redfin; nearby-school rating estimates.
About these neighborhood estimates
Prices and counts describe active listings returned by the provider, excluding coming-soon and nearby search results. They are asking prices, not sold prices, and may not include every home for sale.
Nearby-school grades are FastExpert estimates from the average available ratings of unique public schools returned for sampled neighborhood properties. A: 8–10; B: 6–under 8; C: 4–under 6; D: 2–under 4; F: 1–under 2. Unrated schools are excluded. Nearby schools may not be assigned to a specific address.
Photos show identified local landmarks. Five neighborhoods are shown, ordered by property count. Median asking price breaks a tie.