



I love the Town of Queen Creek. In the past few years this town has blown up. You can be on the "outskirts" of town, yet still be close. You can find homes on larger lots in Queen Creek, as well as homes more budget friendly on smaller lots. They have lots of shopping, food, and entertainment. New subdivisions are sprouting up everywhere!
Queen Creek, AZ Housing Market & City Data
Explore key insights and real experiences from people who call Queen Creek home. Use the data below as a starting point to compare and discover what makes this city a great place to live.
5.0
Average City Rating
50,890
Population Estimate
$348,289
Median Home Value
96.5%
Employment Rate
38.3%
Bachelor's Degree+
Queen Creek City Reviews
Real experiences from people who call Queen Creek home.
5.0(1 Reviews)
Housing & Demographic Overview
Key insights about the community
Data as of September 2026
HOUSING DATA (September 2026)
Median Price per SqFt$272
Median Listing Price$750,000
Median Days on Market69
Active Listings331
New Listings110
Total Listings (Active + Pending)434
Avg Listing Price$1,001,209
Avg Listing Price Change MoM0%
Avg Listing Price Change YoY2%
HOUSEHOLD OVERVIEW
Family Size3.79
Family Dual Income60.1
Median Household Income$105,729
Median Individual Income$43,008
Home Ownership86.7%
Home Value$348,289
Median Rent$1,590
Rent Burden31.6%
Poverty4.7%
EDUCATION, GENDER & MARITAL STATUS
EDUCATION
- No Highschool Degree or GED4.1%
- Highschool Education22.2%
- Some College35.4%
- Bachelors Degree24.8%
- Graduate Degree13.5%
- Total College or Above38.3%
- Stem Degree44.1%
GENDER BREAKDOWN
- Male50.2%
- Female49.8%
MARITAL STATUS
- Married61.4%
- Divorced7.6%
- Never Married28.2%
- Widowed2.8%
CITY DATA & AGE BREAKDOWN
CITY DATA
CityQueen Creek
State IDAZ
Population50,890
AGE BREAKDOWN
| Age Group | % of Population |
|---|---|
| Under 18 | 35.1% |
| 19–29 | 8.7% |
| 30–39 | 15.6% |
| 40–49 | 16.2% |
| Age Group | % of Population |
|---|---|
| 50–59 | 10.7% |
| 60–69 | 8.5% |
| 70–79 | 4.0% |
| 80+ | 1.3% |
WORKFORCE, ETHNICITY & OTHER
WORKFORCE
Labor Force Participation66.4%
Unemployment Rate3.5%
Disabled7.2%
ETHNICITY
White87.5%
Black2.5%
Asian3.1%
Native American0.6%
Pacific Islander0.1%
Other2.7%
Multiple3.4%
OTHER
Hispanic15.8%
Limited English0.5%
Health Uninsured5.0%
Veteran6.7%
Local Discussions
Community questions and conversations about living in Queen Creek, AZ.
- Is Queen Creek, AZ a good place to buy a house?0
Local perspectives on Queen Creek home prices, buyer demand, neighborhoods, and what to consider before buying a home.
- What are the best neighborhoods in Queen Creek, AZ for families?0
Local insights on Queen Creek neighborhoods, schools, parks, commute times, and other factors families may want to consider.
- What should home buyers know about the Queen Creek, AZ housing market?0
Local insights on Queen Creek home prices, housing inventory, buyer competition, and current real estate market conditions.
- Is it better to buy or rent a home in Queen Creek, AZ?0
Compare Queen Creek home prices, rents, monthly housing costs, and other factors that can affect the decision to buy or rent.
- What are the most affordable neighborhoods in Queen Creek, AZ?0
Explore Queen Creek neighborhoods where home buyers may find more affordable housing options and better value for their budget.
- How much income do you need to buy a house in Queen Creek, AZ?0
Learn how Queen Creek home prices, down payments, mortgage costs, and other expenses can affect how much income buyers may need.
- How much are property taxes on a home in Queen Creek, AZ?0
Learn how Queen Creek property taxes are calculated and how they can affect the overall cost of owning a home.
- What are the best neighborhoods in Queen Creek, AZ for first-time home buyers?0
Explore Queen Creek neighborhoods first-time home buyers may consider based on home prices, location, amenities, and lifestyle.
- What is it like to live in Queen Creek, AZ?0
Local perspectives on Queen Creek neighborhoods, cost of living, weather, commuting, things to do, and everyday life.
- What should I know before moving to Queen Creek, AZ?0
What newcomers should know about Queen Creek housing costs, neighborhoods, transportation, weather, and everyday expenses.
Top Real Estate Agents in Queen Creek, AZ

Robin & Steven Drew
The Drew Team at Bliss Realty
Queen Creek, AZ
5.0 (91 reviews)
17 Years of Experience

SUSAN MILLER
YOUR HOME SOLD REALTY LLC
TEMPE, AZ
5.0 (84 reviews)
22 Years of Experience

Shannon Gillette
Real broker 25707 S 183rd Pl Queen Creek AZ 85142 United States
Queen Creek, AZ
5.0 (5 reviews)
20 Years of Experience
Neighborhoods in Queen Creek, AZ
Get to know neighborhoods in Queen Creek, ordered by the number of properties in the provider sample.

Remington Heights ↗
- Median asking price
- $324,900
- / sq ft
- —
- Active listings
- Not available
- properties in discovery sample
- 62
BNearby schools · estimated
7/10 · 3 schools
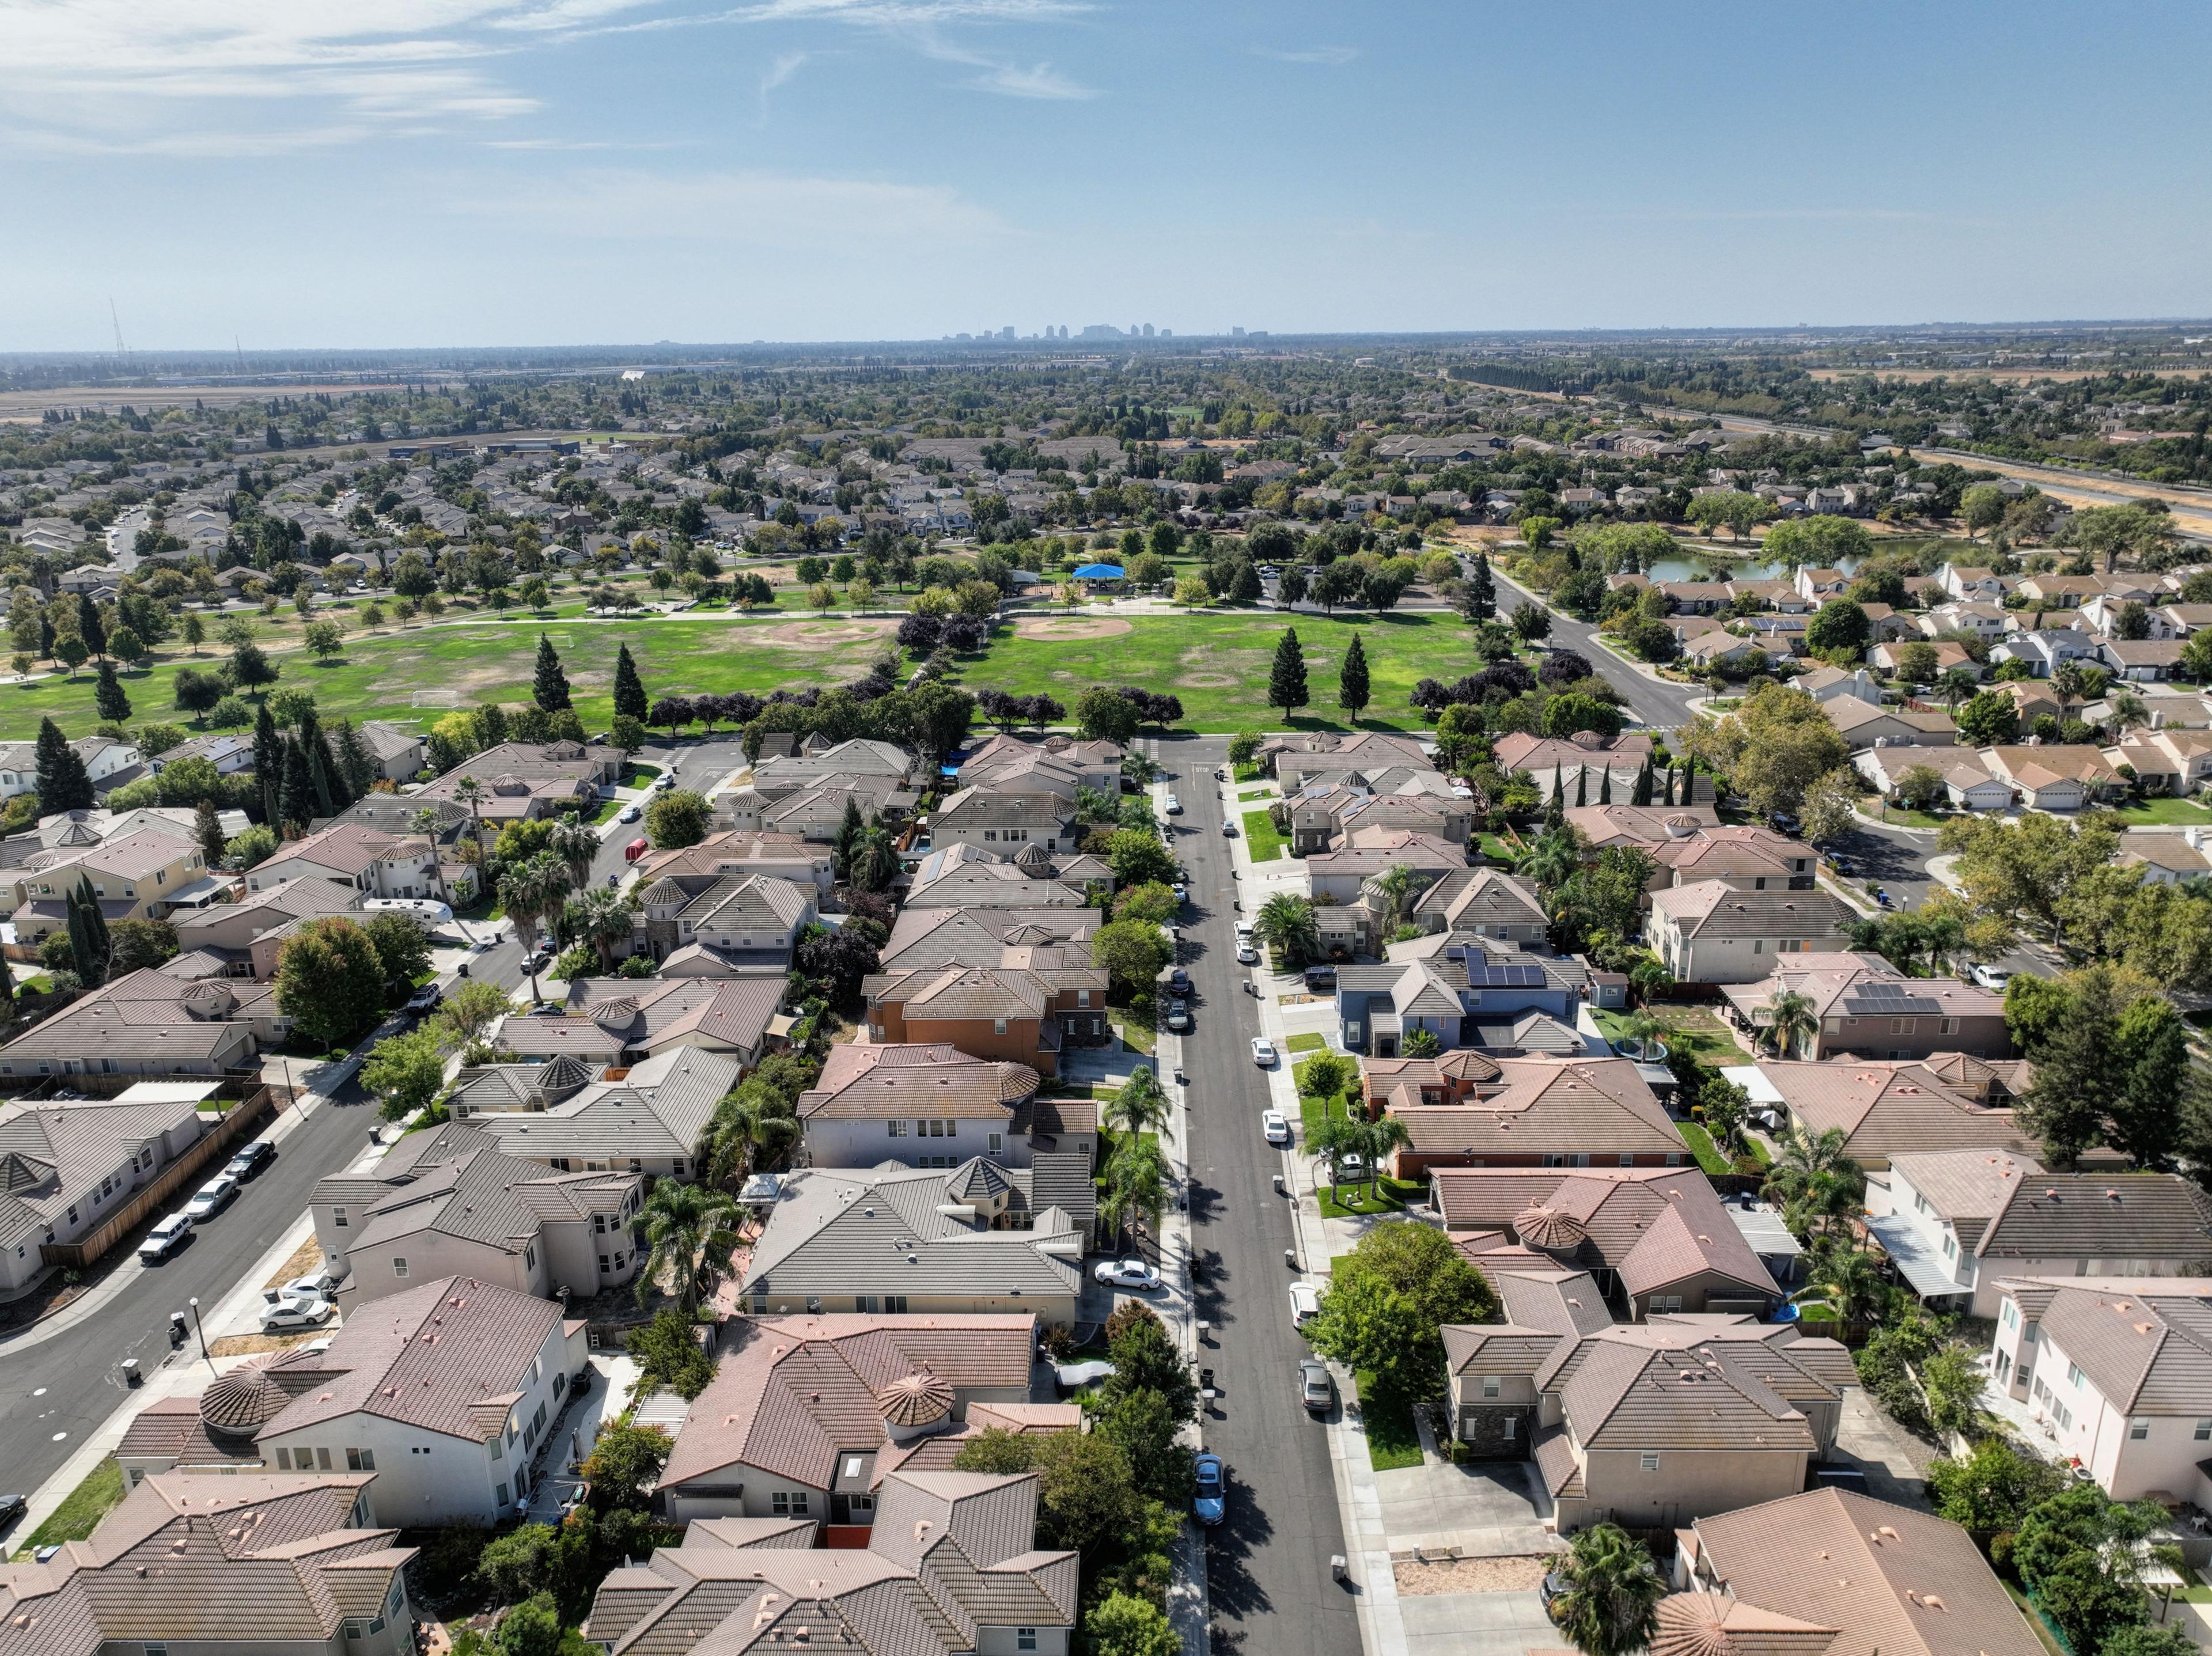
Queenland Manor ↗
- Median asking price
- $259,500
- / sq ft
- $277
- Active listings
- 4
- properties in discovery sample
- 46
BNearby schools · estimated
7/10 · 3 schools
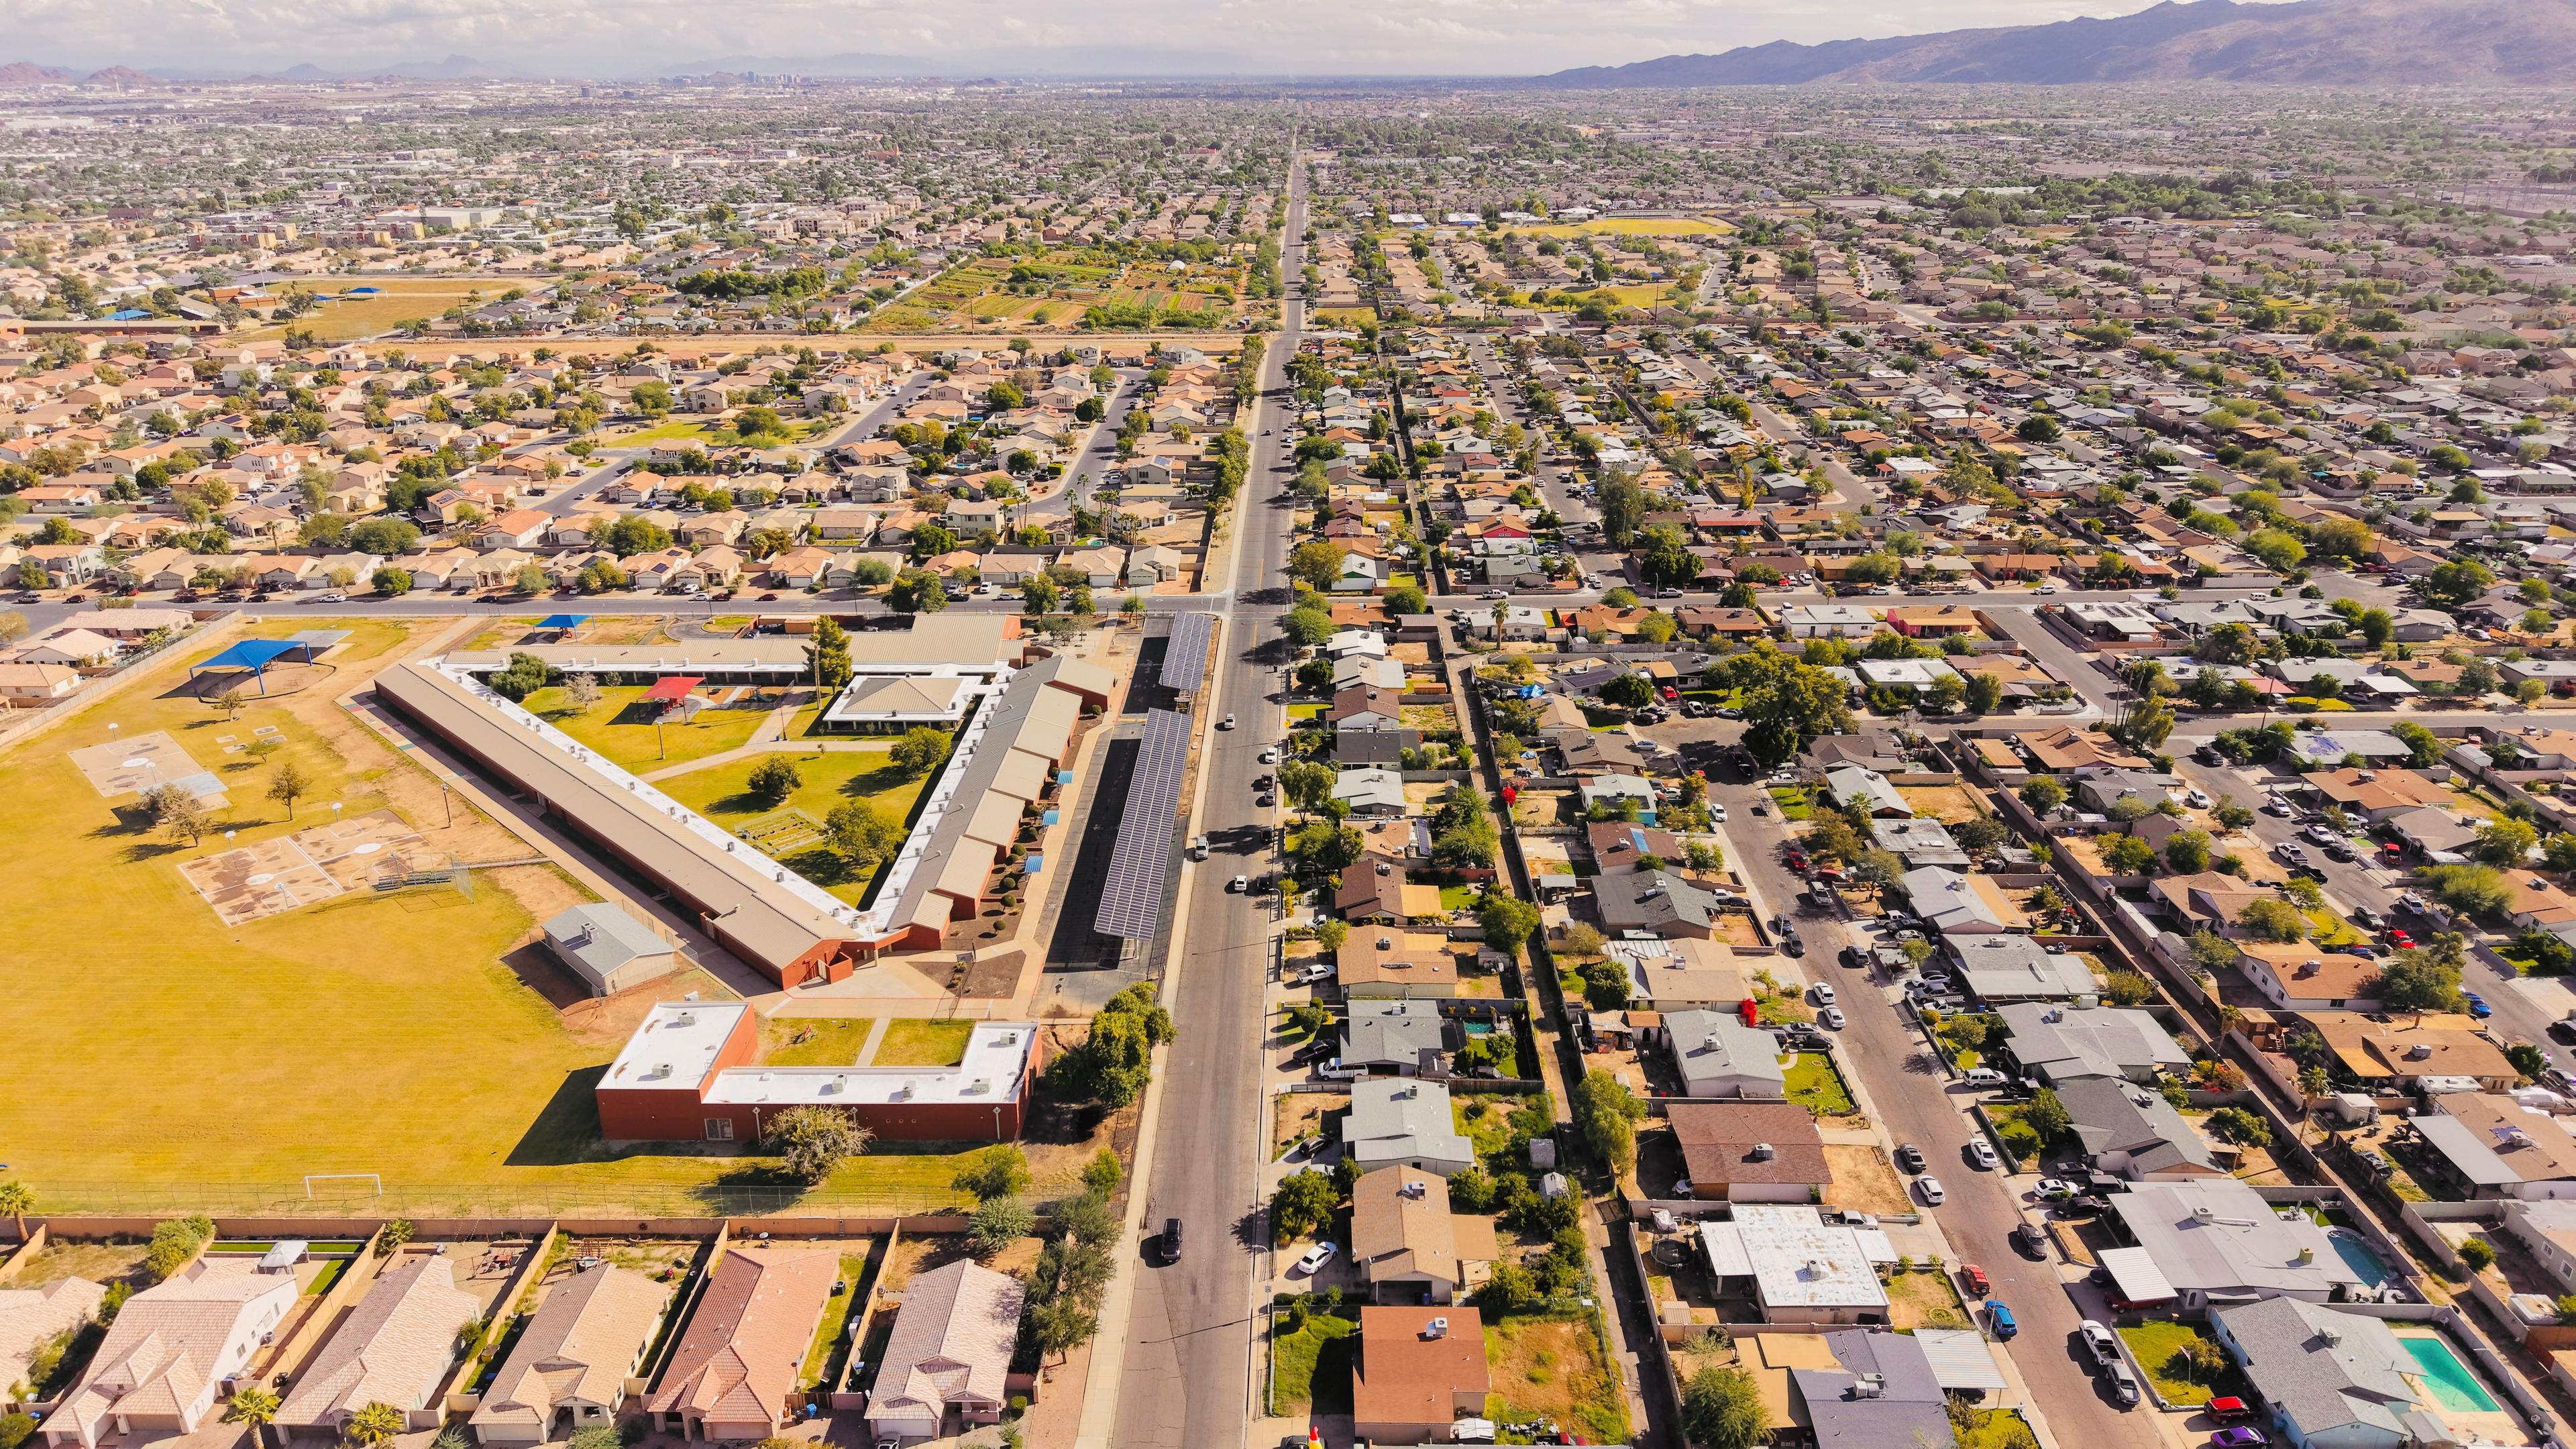
Pegasus Airpark ↗
- Median asking price
- $1,270,000
- / sq ft
- $865
- Active listings
- 7
- properties in discovery sample
- 7
BNearby schools · estimated
6.3/10 · 3 schools
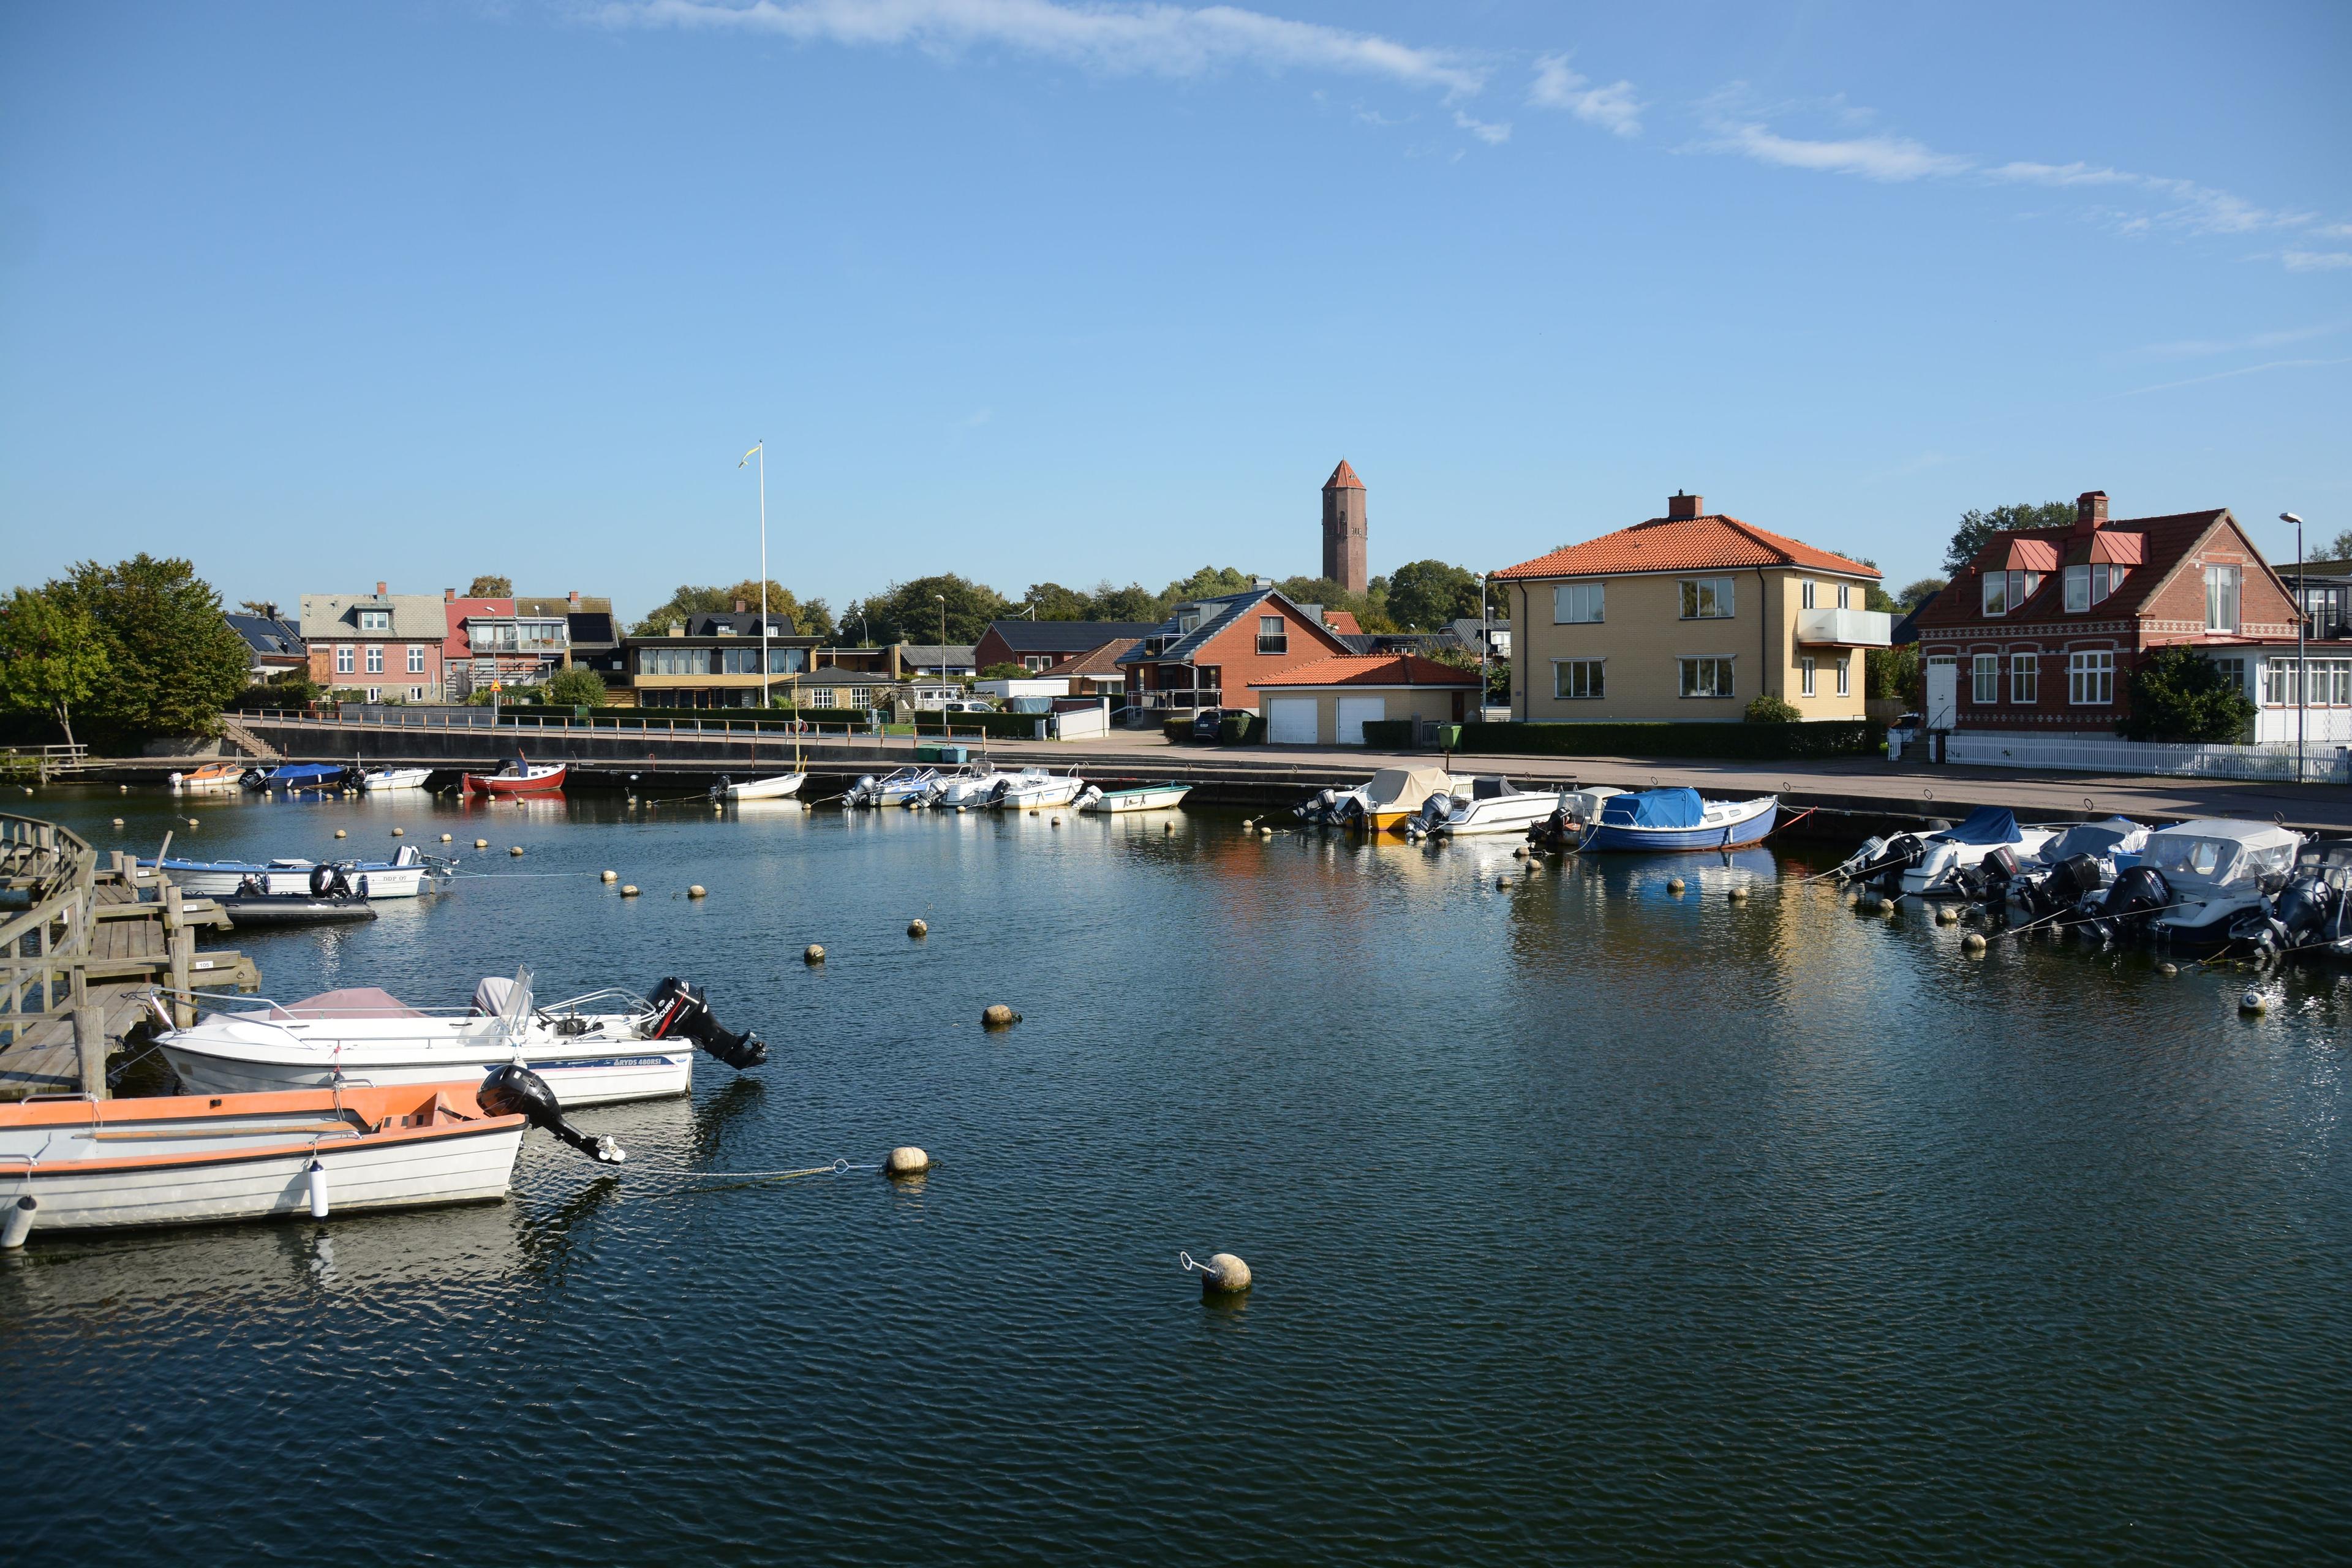
Sun Valley Farms ↗
- Median asking price
- $372,500
- / sq ft
- —
- Active listings
- Not available
- properties in discovery sample
- 6
DNearby schools · estimated
3.5/10 · 6 schools
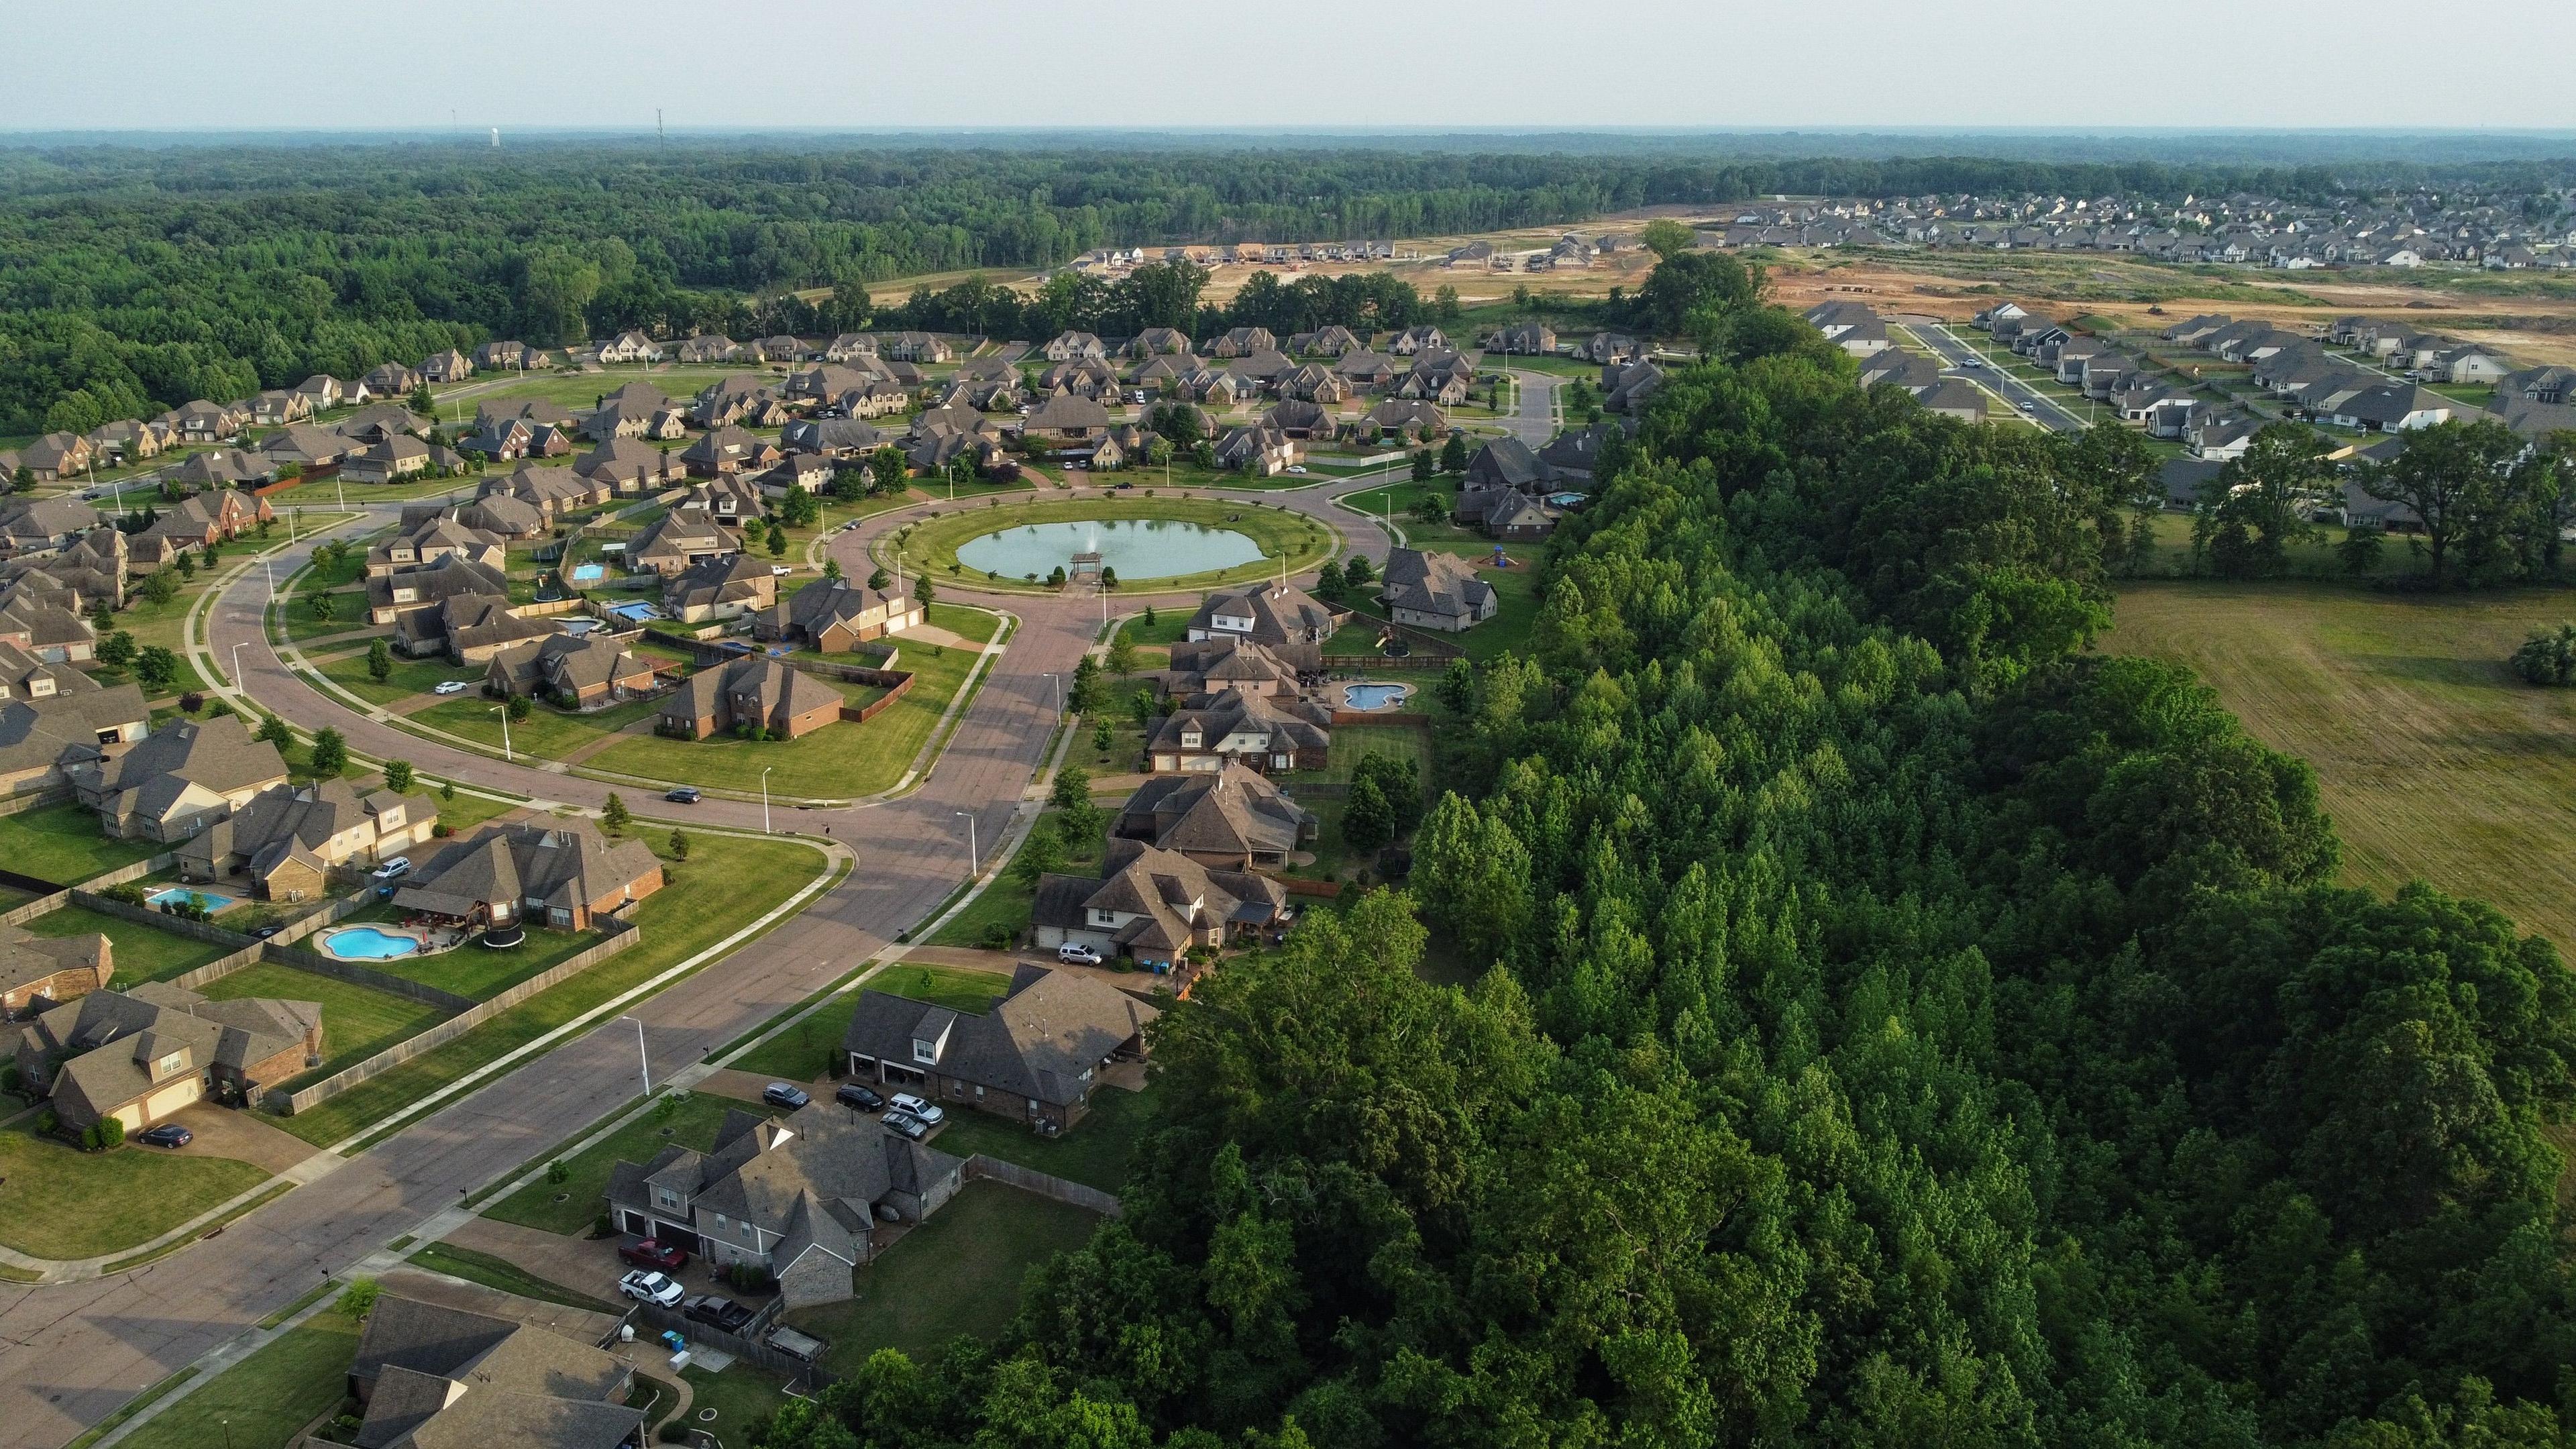
Indigo Trails ↗
- Median asking price
- $440,000
- / sq ft
- —
- Active listings
- Not available
- properties in discovery sample
- 5
BNearby schools · estimated
7.3/10 · 3 schools
Data as of . Listing snapshots from Redfin; nearby-school rating estimates.
About these neighborhood estimates
Prices and counts describe active listings returned by the provider, excluding coming-soon and nearby search results. They are asking prices, not sold prices, and may not include every home for sale.
Nearby-school grades are FastExpert estimates from the average available ratings of unique public schools returned for sampled neighborhood properties. A: 8–10; B: 6–under 8; C: 4–under 6; D: 2–under 4; F: 1–under 2. Unrated schools are excluded. Nearby schools may not be assigned to a specific address.
Photos show identified local landmarks. Five neighborhoods are shown, ordered by property count. Median asking price breaks a tie.