

Ossining, NY Housing Market & City Data
Explore key insights and real experiences from people who call Ossining home. Use the data below as a starting point to compare and discover what makes this city a great place to live.
Housing & Demographic Overview
Key insights about the community
HOUSING DATA (October 2026)
HOUSEHOLD OVERVIEW
EDUCATION, GENDER & MARITAL STATUS
EDUCATION
- No Highschool Degree or GED15.1%
- Highschool Education19.9%
- Some College18.8%
- Bachelors Degree22.2%
- Graduate Degree24.1%
- Total College or Above46.3%
- Stem Degree45.6%
GENDER BREAKDOWN
- Male50.5%
- Female49.5%
MARITAL STATUS
- Married51.9%
- Divorced10.9%
- Never Married32.5%
- Widowed4.7%
CITY DATA & AGE BREAKDOWN
CITY DATA
AGE BREAKDOWN
| Age Group | % of Population |
|---|---|
| Under 18 | 21.9% |
| 19–29 | 10.8% |
| 30–39 | 14.0% |
| 40–49 | 14.8% |
| Age Group | % of Population |
|---|---|
| 50–59 | 14.7% |
| 60–69 | 11.9% |
| 70–79 | 7.2% |
| 80+ | 4.7% |
WORKFORCE, ETHNICITY & OTHER
WORKFORCE
ETHNICITY
OTHER
Local Discussions
Community questions and conversations about living in Ossining, NY.
- Is Ossining, NY a good place to buy a house?0
Local perspectives on Ossining home prices, buyer demand, neighborhoods, and what to consider before buying a home.
- What are the best neighborhoods in Ossining, NY for families?0
Local insights on Ossining neighborhoods, schools, parks, commute times, and other factors families may want to consider.
- What should home buyers know about the Ossining, NY housing market?0
Local insights on Ossining home prices, housing inventory, buyer competition, and current real estate market conditions.
- Is it better to buy or rent a home in Ossining, NY?0
Compare Ossining home prices, rents, monthly housing costs, and other factors that can affect the decision to buy or rent.
- What are the most affordable neighborhoods in Ossining, NY?0
Explore Ossining neighborhoods where home buyers may find more affordable housing options and better value for their budget.
- How much income do you need to buy a house in Ossining, NY?0
Learn how Ossining home prices, down payments, mortgage costs, and other expenses can affect how much income buyers may need.
- How much are property taxes on a home in Ossining, NY?0
Learn how Ossining property taxes are calculated and how they can affect the overall cost of owning a home.
- What are the best neighborhoods in Ossining, NY for first-time home buyers?0
Explore Ossining neighborhoods first-time home buyers may consider based on home prices, location, amenities, and lifestyle.
- What is it like to live in Ossining, NY?0
Local perspectives on Ossining neighborhoods, cost of living, weather, commuting, things to do, and everyday life.
- What should I know before moving to Ossining, NY?0
What newcomers should know about Ossining housing costs, neighborhoods, transportation, weather, and everyday expenses.
Top Real Estate Agents in Ossining, NY


Neighborhoods in Ossining, NY
Get to know neighborhoods in Ossining, ordered by the number of properties in the provider sample.
Eagle Bay Condominiums ↗
- Median asking price
- $425,000
- / sq ft
- —
- Active listings
- Not available
- properties in discovery sample
- 9
—Nearby schools · estimated
Ratings not available
Data as of . Listing snapshots from Redfin; nearby-school rating estimates.
About these neighborhood estimates
Prices and counts describe active listings returned by the provider, excluding coming-soon and nearby search results. They are asking prices, not sold prices, and may not include every home for sale.
Nearby-school grades are FastExpert estimates from the average available ratings of unique public schools returned for sampled neighborhood properties. A: 8–10; B: 6–under 8; C: 4–under 6; D: 2–under 4; F: 1–under 2. Unrated schools are excluded. Nearby schools may not be assigned to a specific address.
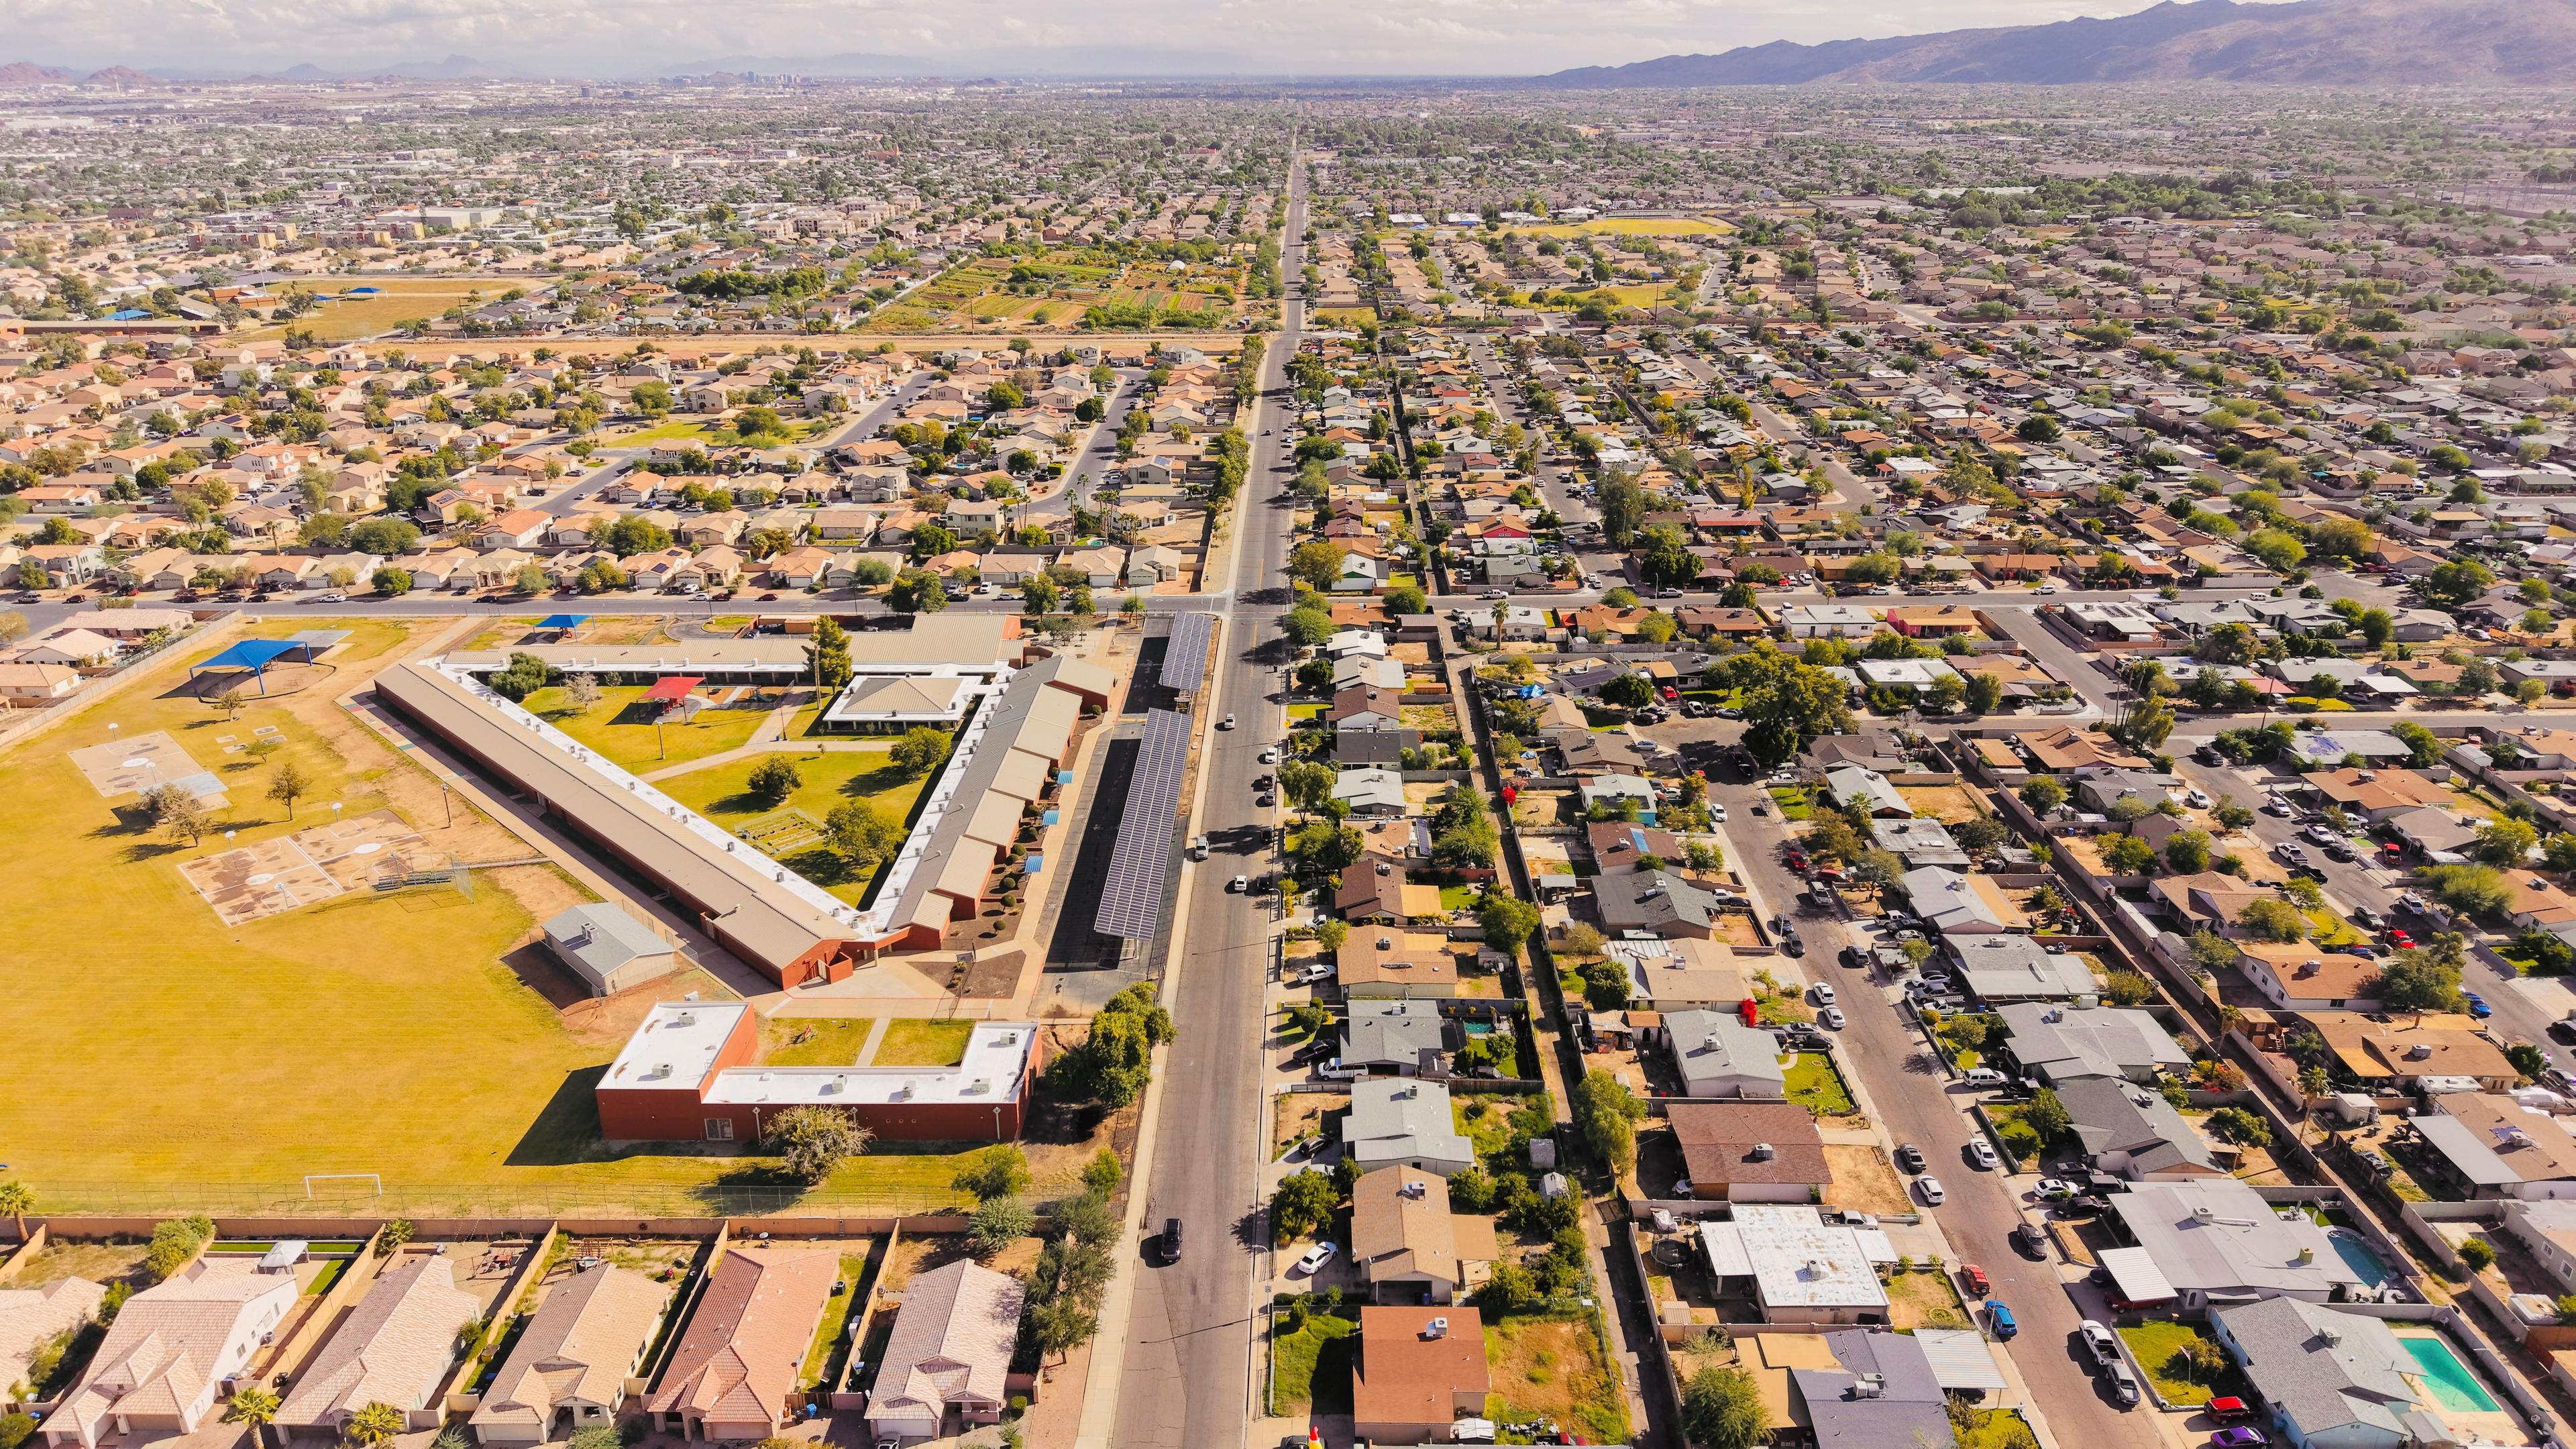
Photos show identified local landmarks. Five neighborhoods are shown, ordered by property count. Median asking price breaks a tie.