

YOUR NEIGHBORHOOD GUIDE · OAKLAND, CA
Get to know
Lower Bottoms.
Explore Lower Bottoms in Oakland, CA: nearby homes, schools and everyday places.
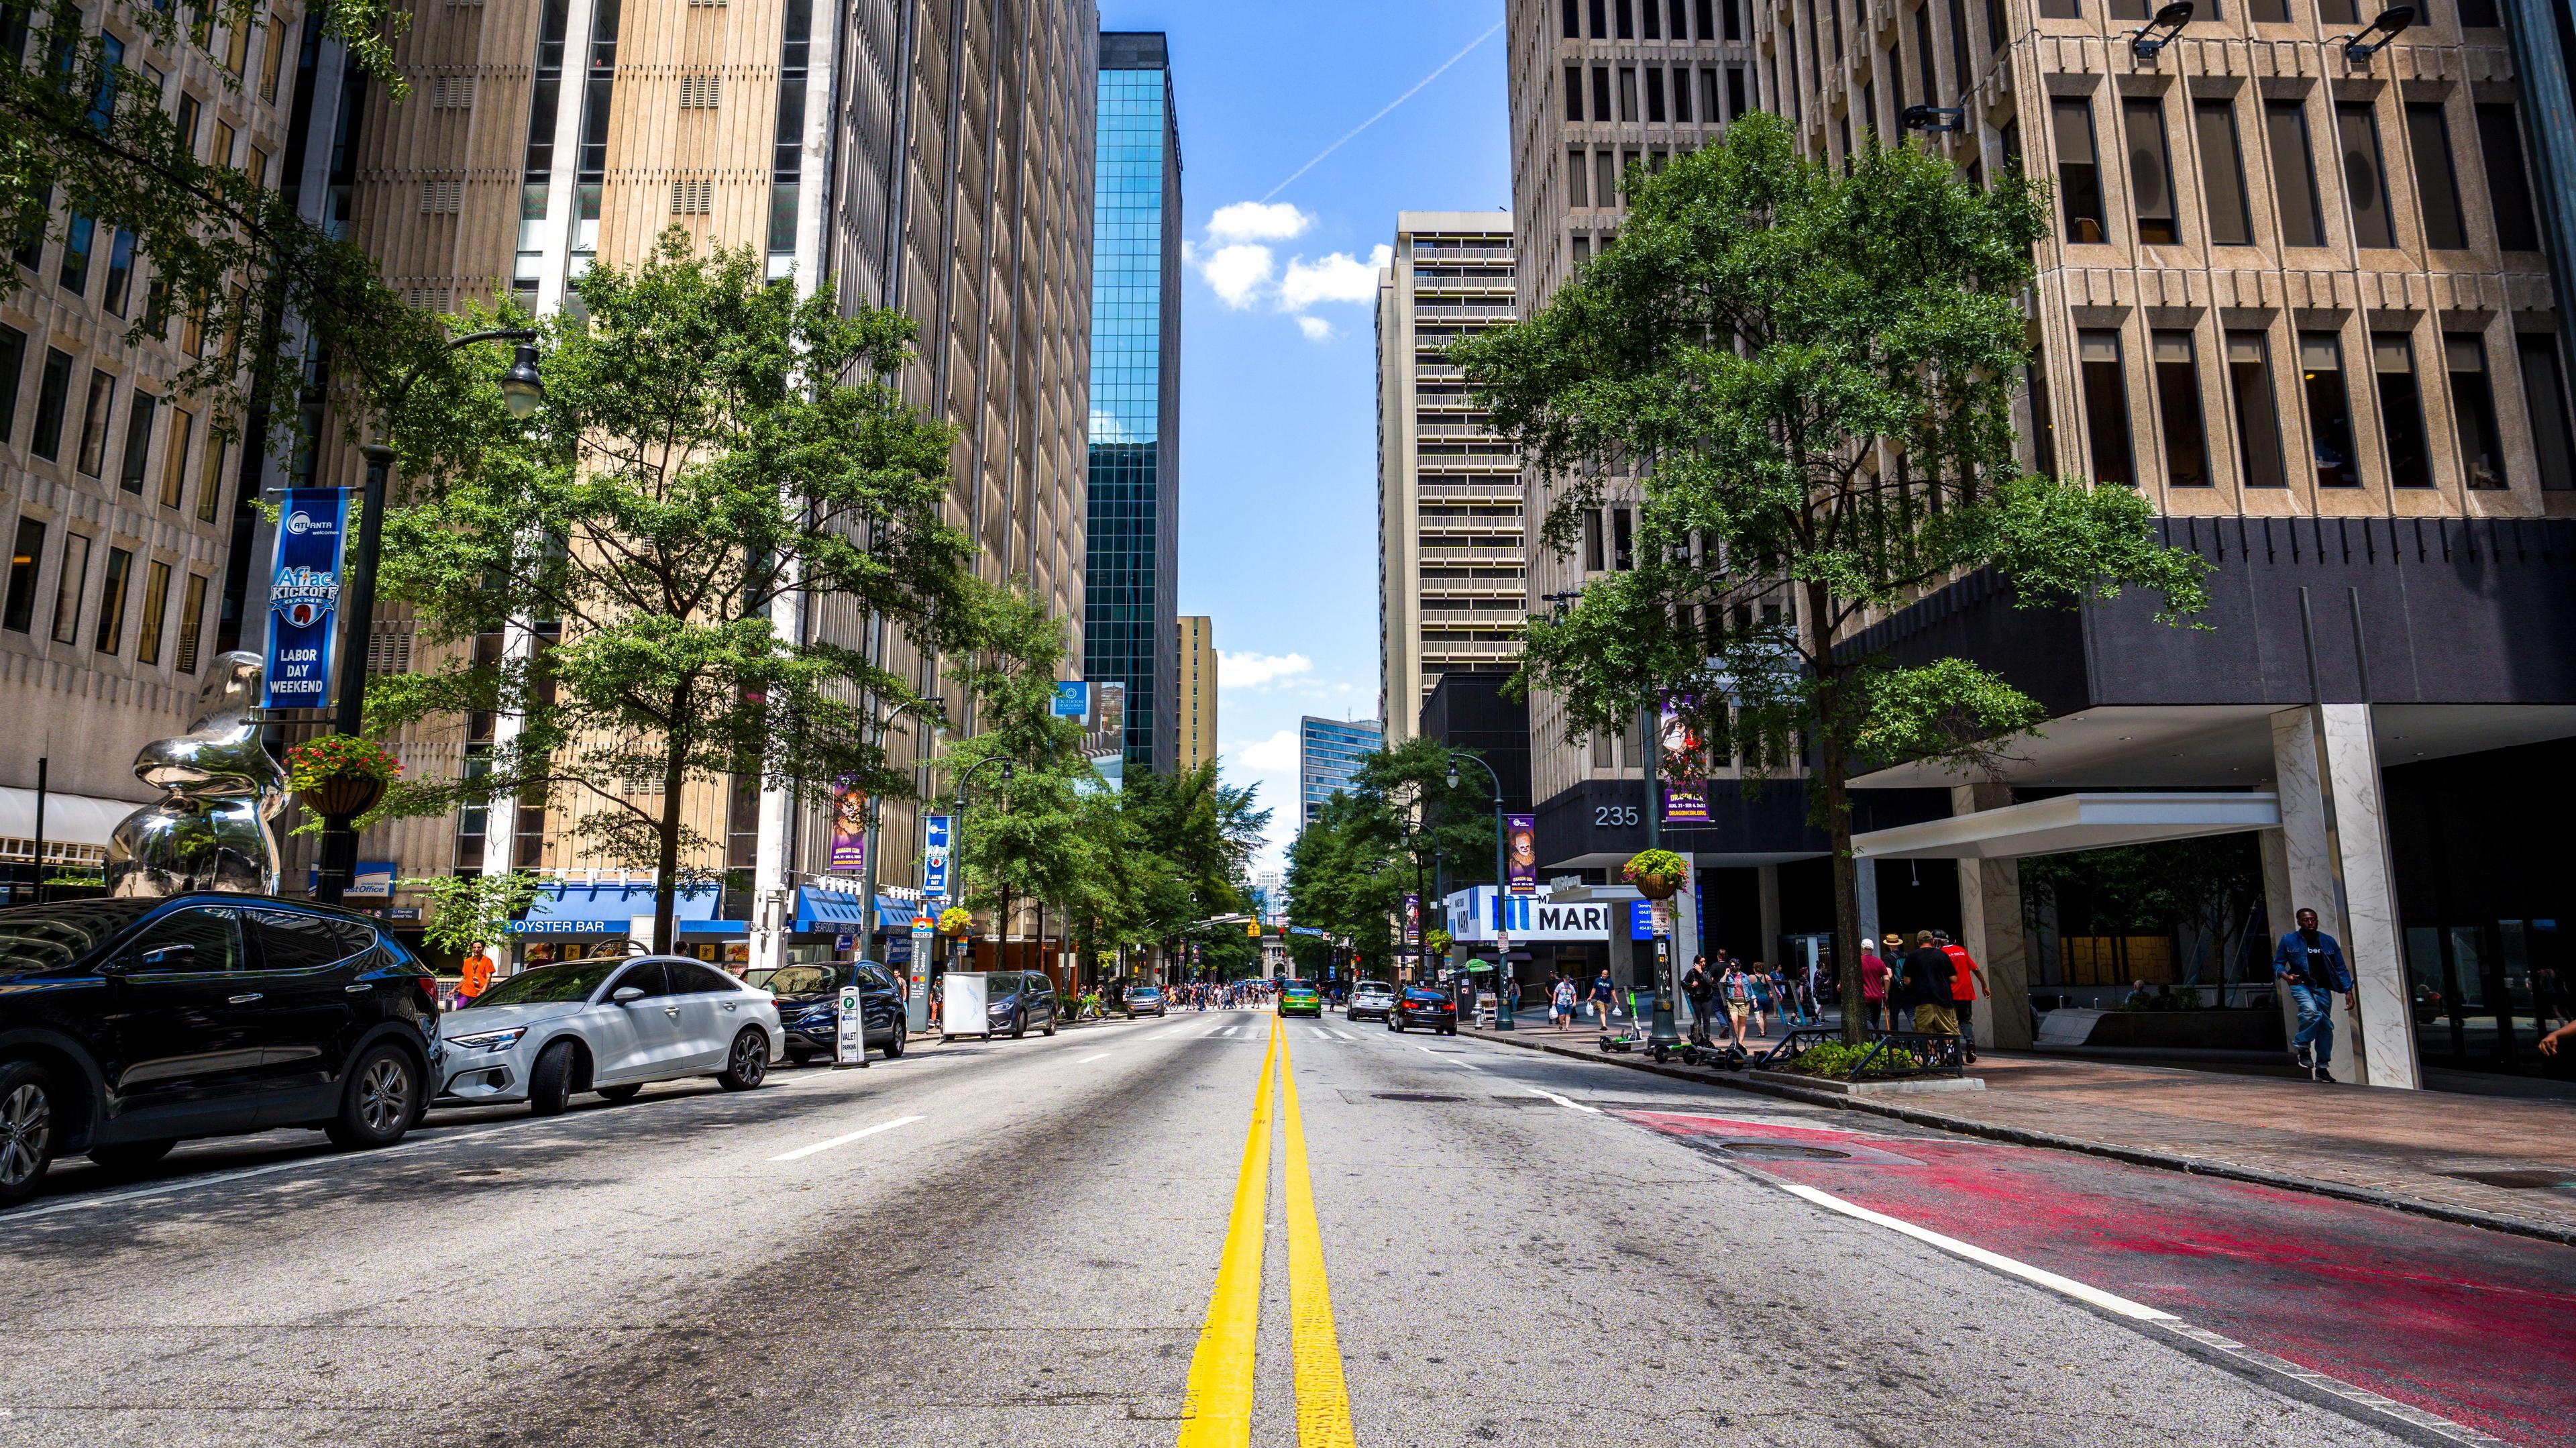
LIFE IN LOWER BOTTOMS
Get a feel for Lower Bottoms.
Lower Bottoms is a neighborhood in Oakland, CA. This guide brings together a housing snapshot and places to explore in and around the community.
LOCAL KNOWLEDGE MAKES A DIFFERENCE
Work with Top Real Estate Agents in Lower Bottoms
Explore top real estate agents in Oakland who serve the Lower Bottoms neighborhood. Compare their experience, verified reviews, and profiles. A neighborhood-specific rating for Lower Bottoms is not currently available.



A LOOK AT THE MARKET
Lower Bottoms Housing Market
Asking prices come from active listings. Recorded sales cover to . A dash means that figure was not available.
What kinds of homes are here?
29 residential property records give a broader picture of Lower Bottoms, including homes that aren’t for sale.
Updated 2026-10-15. 11 land or other records are excluded from this housing mix. These are property classifications, not a census of individual homes.
How does Lower Bottoms compare?
Compare median asking prices across Oakland neighborhoods.
| Neighborhood | Median asking price | Compared with Lower Bottoms | Sale price / sq ft | Recorded sales |
|---|---|---|---|---|
| Lower Bottoms This neighborhood | $613,500 | — | $470 | 0 |
| Montclair Hills | $1,049,500 | 71% higher | — | 0 |
| Laurel | $583,975 | 5% lower | $526 | 1 |
| North Oakland | $787,500 | 28% higher | $524 | 1 |
| Bushrod | $895,000 | 46% higher | $466 | 2 |
| West Oakland | $447,500 | 27% lower | $465 | 1 |
Median asking price and price per square foot come from the same listing sample as the neighborhood cards. Recorded sales cover 2025-10-15 to 2026-10-15. A dash means that figure was not available.
Explore nearby neighborhoods in Oakland
Montclair Hills ↗
- Median asking price
- $1,049,500
- / sq ft
- —
- Active listings
- Not available
- properties in discovery sample
- 32
BNearby schools · estimated
6.3/10 · 10 schools

Laurel ↗
- Median asking price
- $583,975
- / sq ft
- $526
- Active listings
- 7
- properties in discovery sample
- 23
DNearby schools · estimated
3/10 · 8 schools
North Oakland ↗
- Median asking price
- $787,500
- / sq ft
- $524
- Active listings
- 99
- properties in discovery sample
- 21
CNearby schools · estimated
4.9/10 · 22 schools
Bushrod ↗
- Median asking price
- $895,000
- / sq ft
- $466
- Active listings
- 11
- properties in discovery sample
- 16
CNearby schools · estimated
5.6/10 · 12 schools
West Oakland ↗
- Median asking price
- $447,500
- / sq ft
- $465
- Active listings
- 69
- properties in discovery sample
- 15
DNearby schools · estimated
3/10 · 13 schools
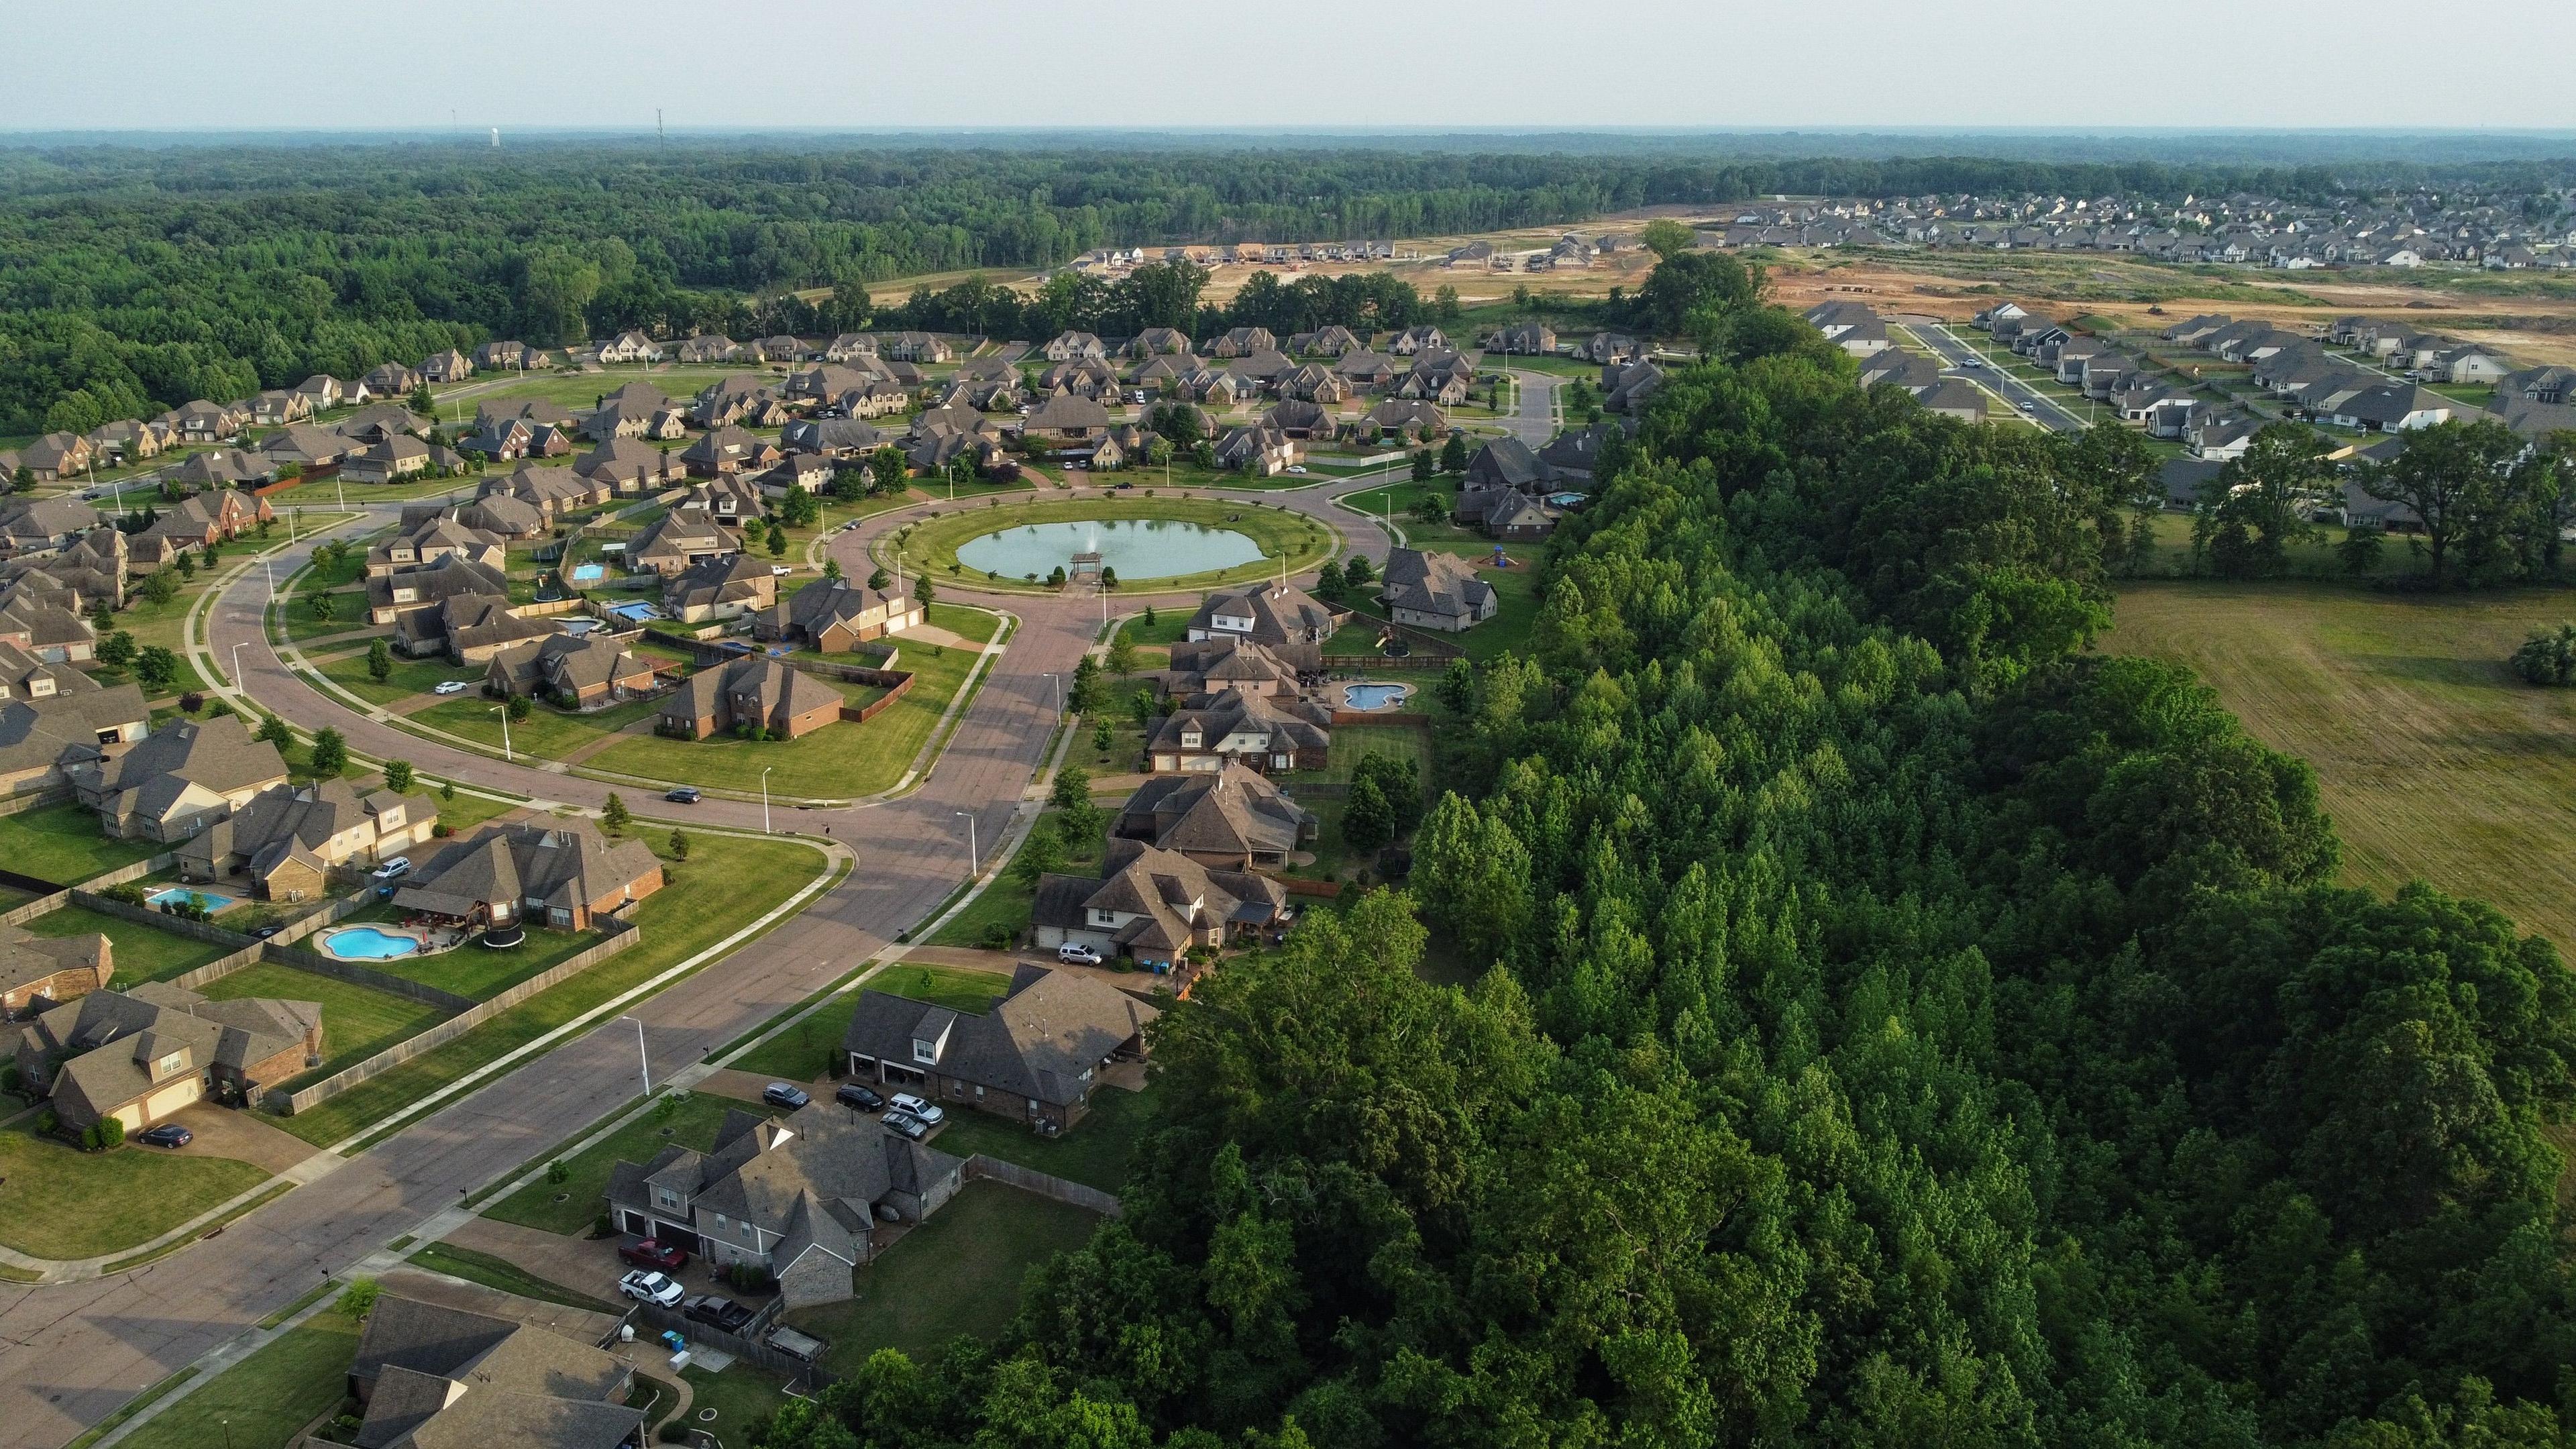
Median asking price is the midpoint of listing prices in the discovery sample. A dash means that figure was not available. Photos show community or nearby landmarks.
See all featured Oakland neighborhoods →What Is It Like to Live in Lower Bottoms?
Nearby schools
Estimated grade D · 2.7/10Public schools returned for sampled Lower Bottoms properties. Attendance depends on the specific address.
L marks Lower Bottoms’s center. Shading shows a half-mile radius around that point, not a neighborhood boundary. Numbered pins match the places below.
School ratings · 2026-10-15. Grade methodology is below.
THE CITY AROUND YOU
Oakland demographics & households
Citywide context for a move to Lower Bottoms. These figures describe Oakland as a whole.
Explore Oakland’s age distribution
From FastExpert’s existing Oakland city-data source, retrieved 2026-10-15; source year was not supplied. Explore all Oakland city data →
FIND YOUR PLACE HERE
Homes for sale in Lower Bottoms
12 active listings with photos in Oakland, CA.
 For sale
3 beds · 2 baths · 1,014 sq ft
5224 Congress Ave
Oakland, CA
 For sale
5 beds · 4 baths · 2,806 sq ft
855 Northvale Road
Oakland, CA
 For sale
4 beds · 1 baths · 1,615 sq ft
2207 East 19th Street
Oakland, CA
 For sale
8 beds · 5 baths · 3,569 sq ft
2619 E 16th St
Oakland, CA
 For sale
5 beds · 3 baths · 2,161 sq ft
634 22nd Street
Oakland, CA
 For sale
2 beds · 1 baths · 1,259 sq ft
3007 58th Avenue
Oakland, CA
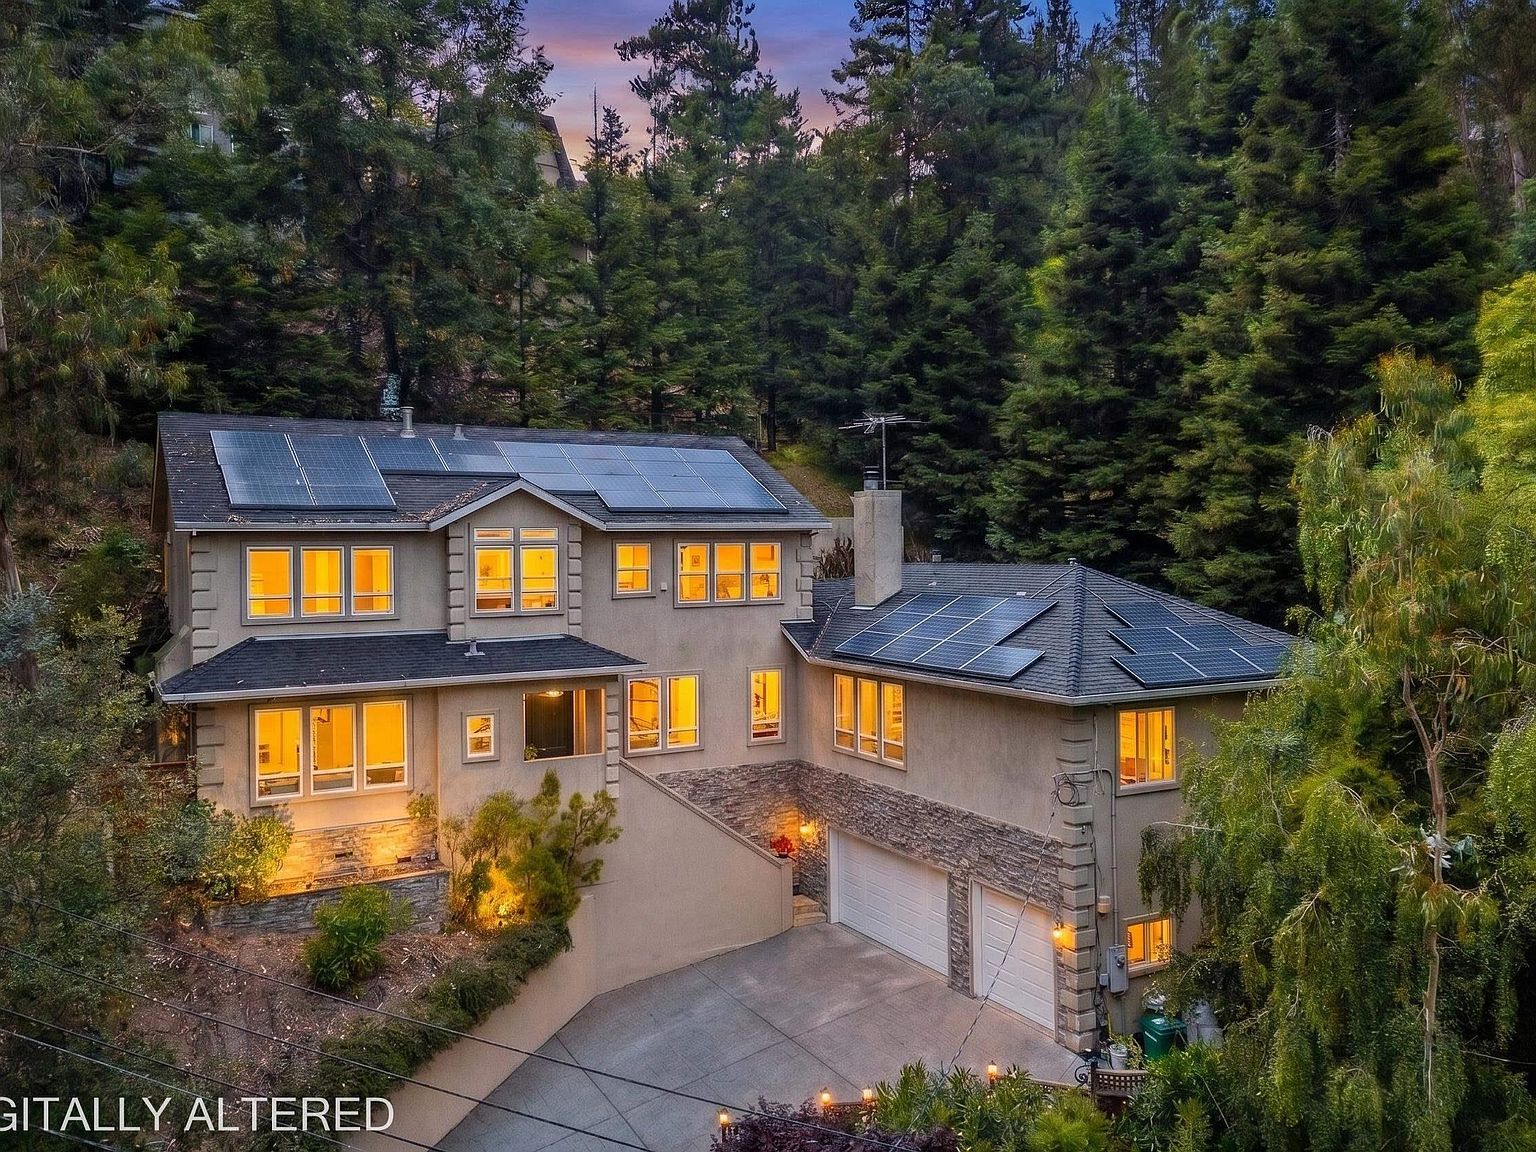 For sale
5 beds · 4 baths · 3,740 sq ft
7010 Pinehaven Rd
Oakland, CA
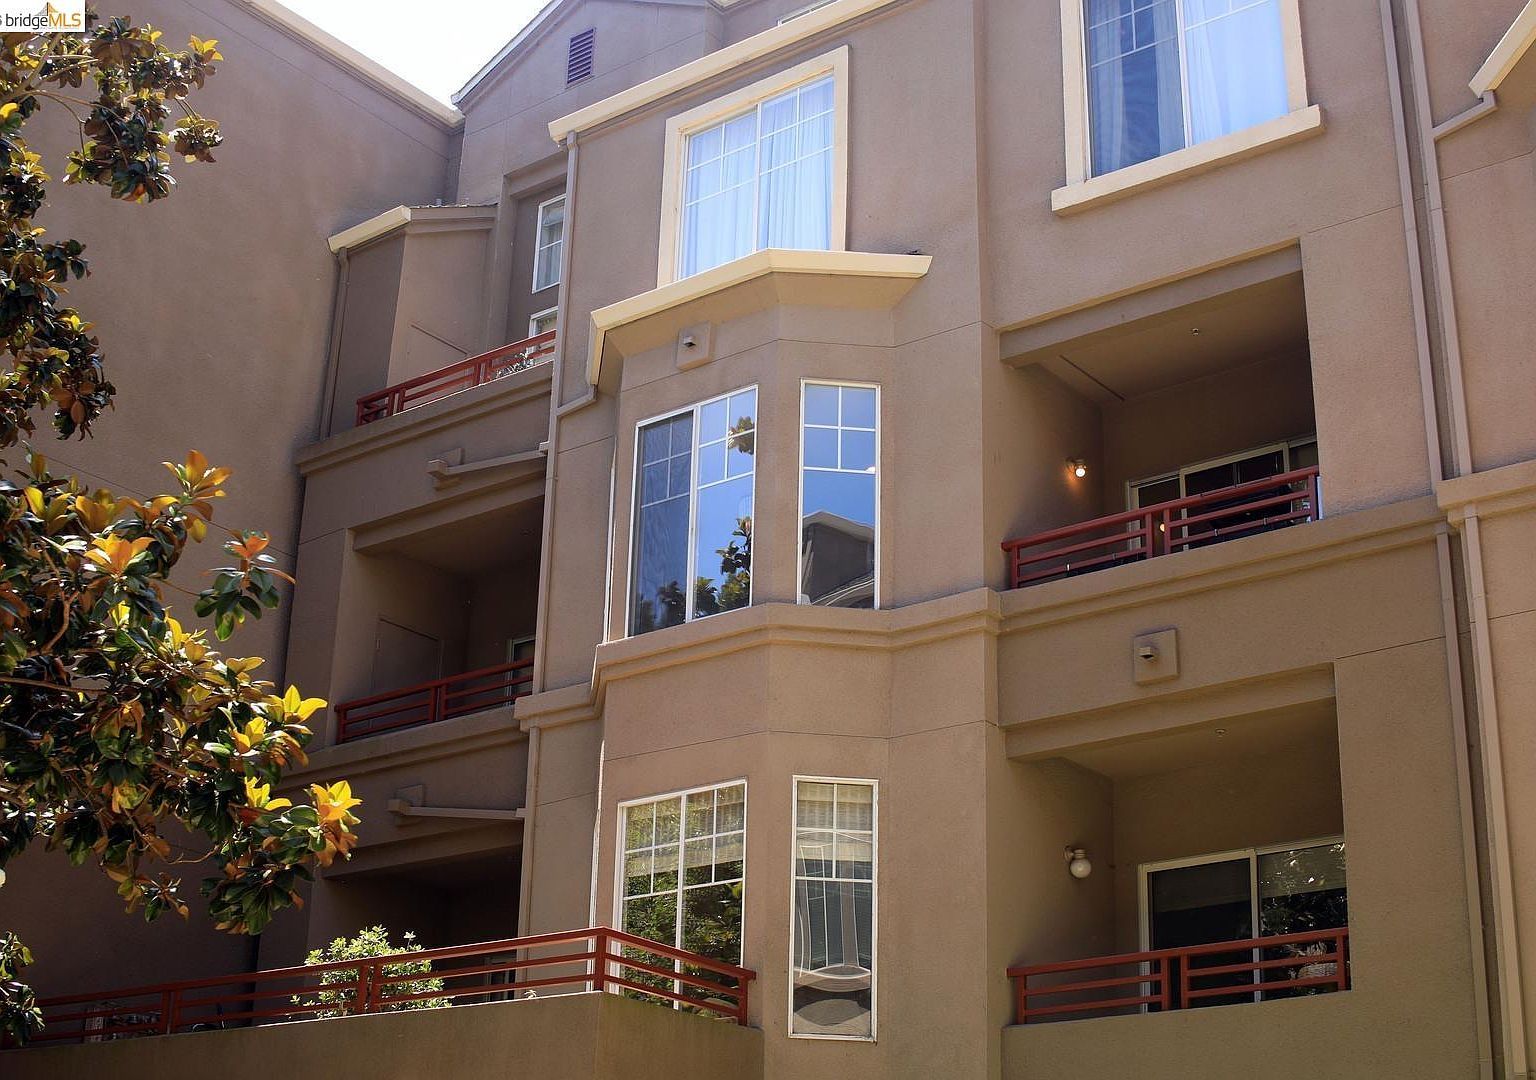 For sale
2 beds · 2 baths · 1,095 sq ft
280 Caldecott Ln Unit 202
Oakland, CA
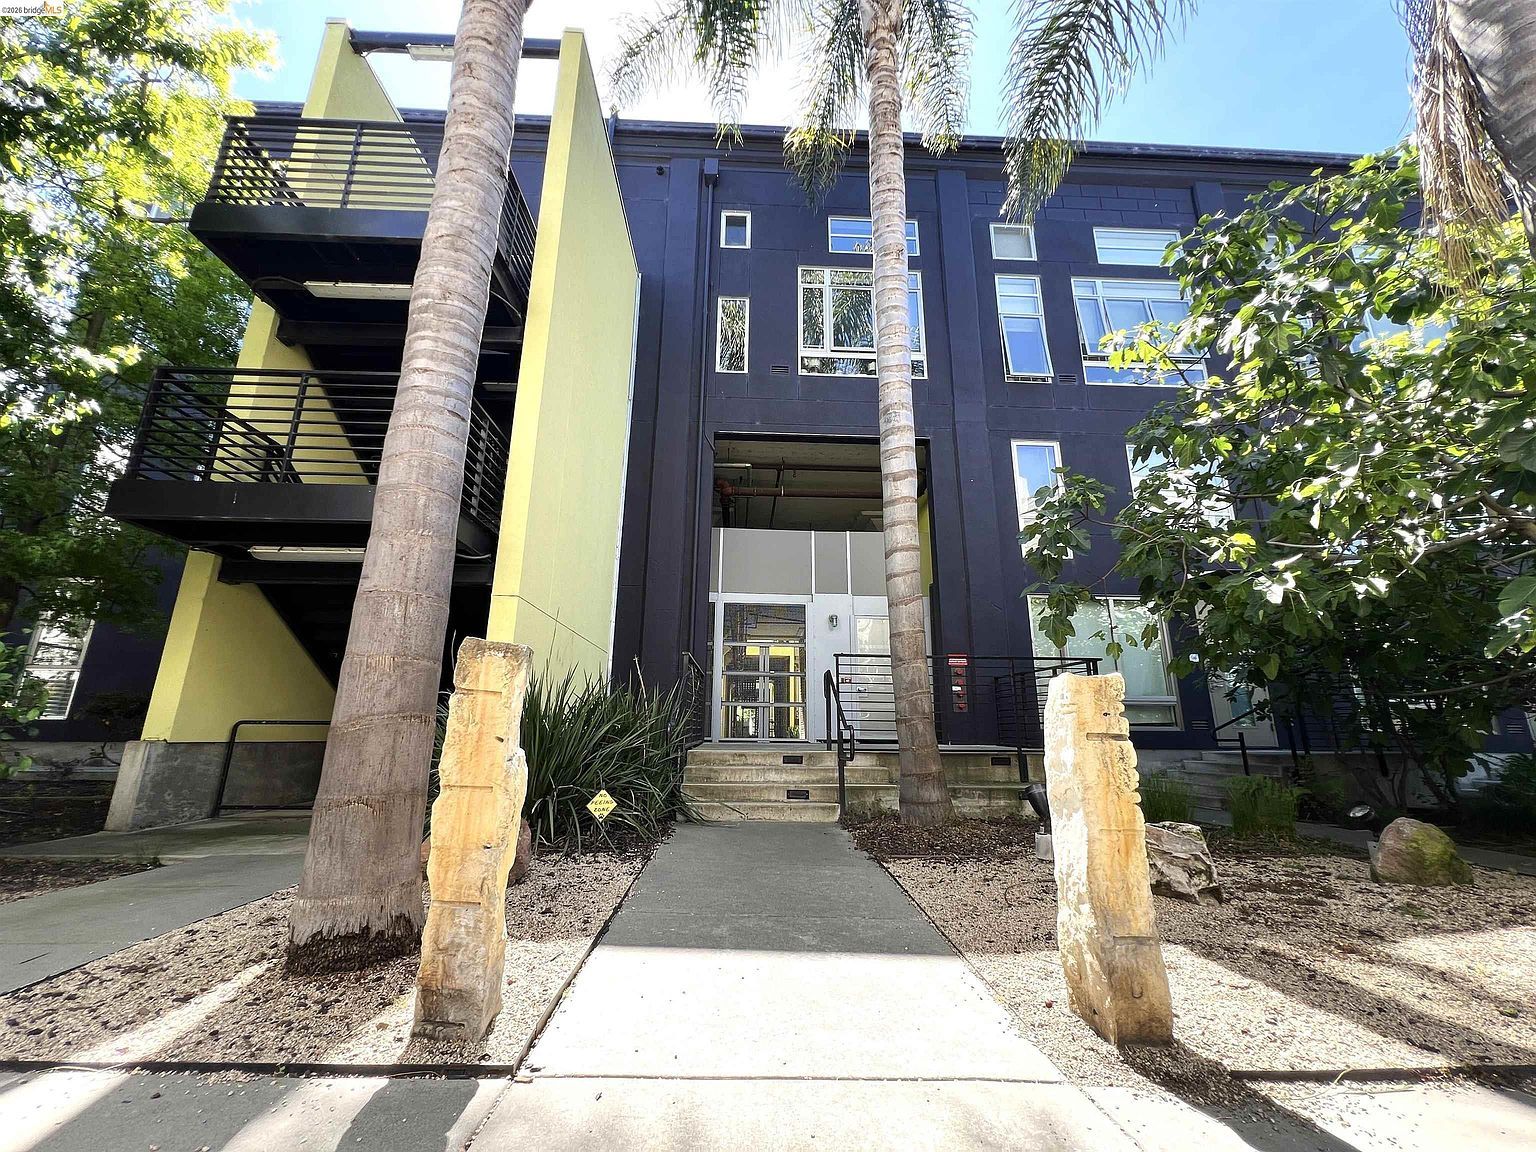 For sale
2 beds · 2 baths · 1,345 sq ft
1253 Pine St
Oakland, CA
 For sale
0 beds · 0 baths · 0 sq ft
Chelton Dr
Oakland, CA
 For sale
7 beds · 3 baths · 2,330 sq ft
6029 Macarthur Blvd
Oakland, CA
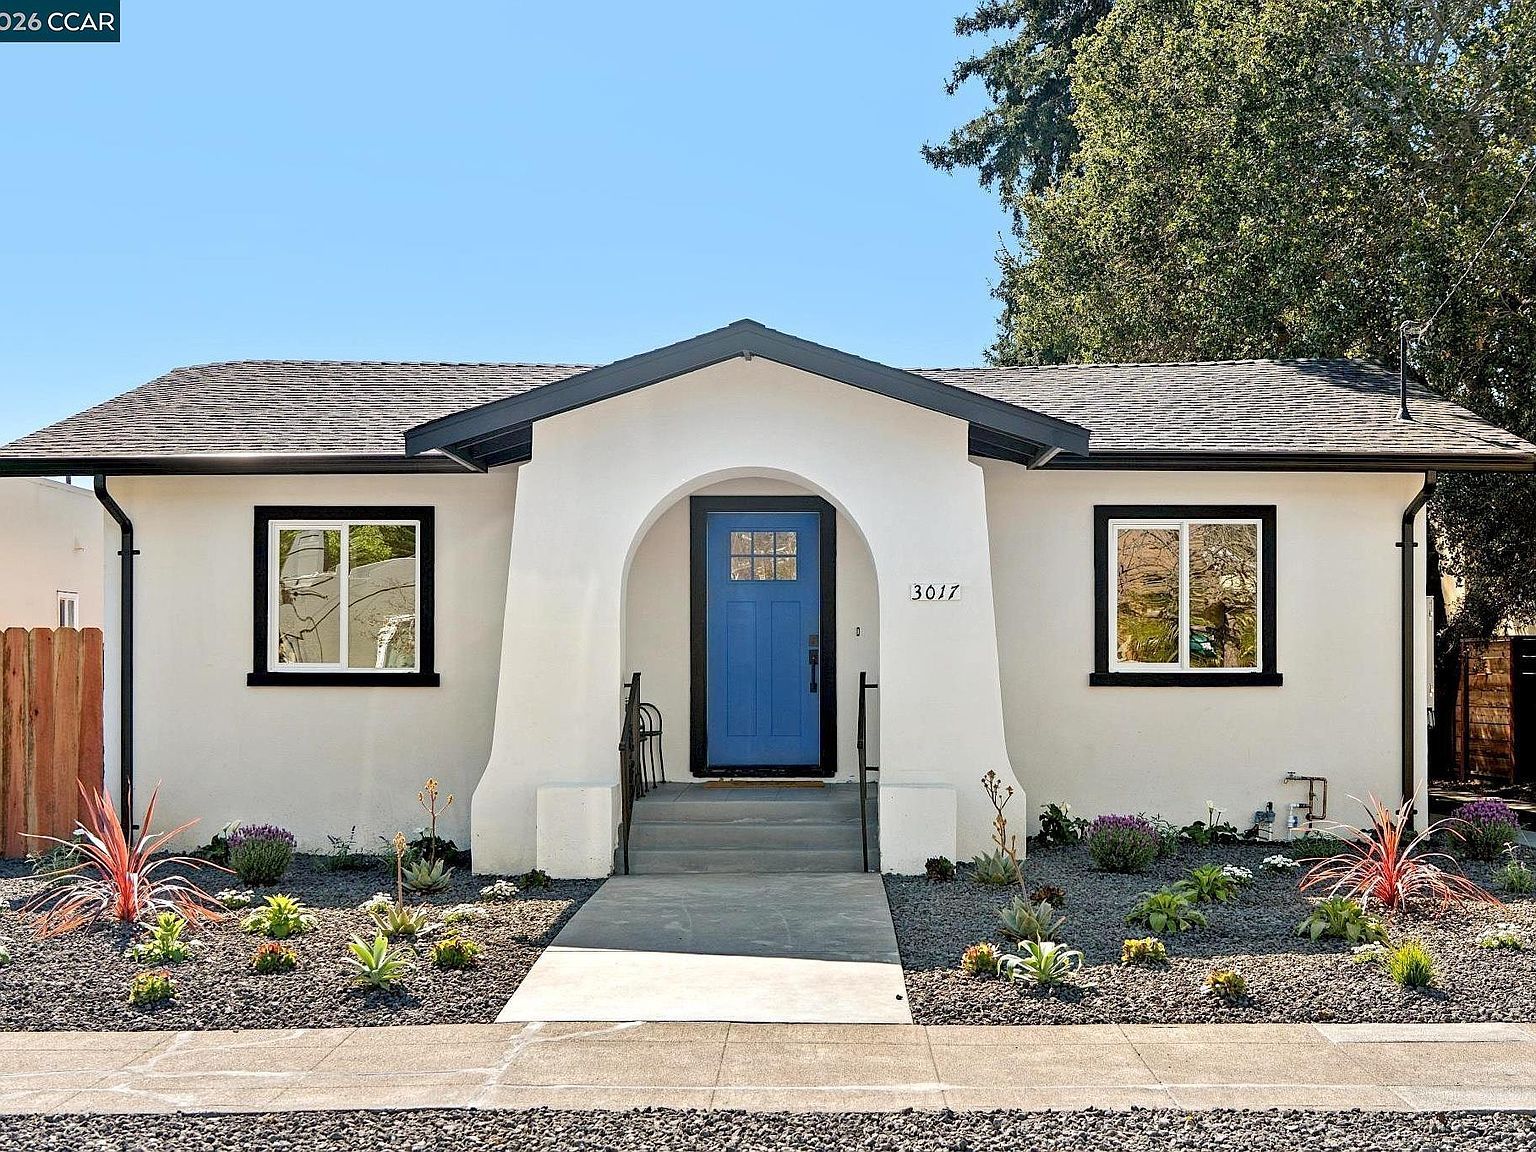 For sale
3 beds · 2 baths · 1,661 sq ft
3017 Madeline St
Oakland, CA
KEEP EXPLORING
Get to know Oakland.
Explore the broader area’s housing and demographic context.
Frequently Asked Questions
Frequently Asked Questions About Lower Bottoms
Common questions about homes, the housing market, and daily life in Lower Bottoms, Oakland.
What types of homes are in Lower Bottoms?
Answer here
How Competitive Is the Lower Bottoms Housing Market?
Answer here
Is Lower Bottoms, Oakland a good neighborhood to live in?
Answer here
Pros and cons of living in Lower Bottoms, Oakland?
Answer here
Cost of living in Lower Bottoms, Oakland?
Answer here
How can I find a real estate agent serving Lower Bottoms?
Answer here
When is the best time to sell real estate in Lower Bottoms?
Answer here
When is the best time to buy real estate in Lower Bottoms?
Answer here
Sources, dates & how we calculate estimates
Nearby places and photos come from an approved snapshot. Viewing this page does not call Google Places. A controlled refresh can still search within 5 km of the center. Recreation combines park, lake, trail and club searches, removes duplicates and keeps results within 5 miles. Restaurant ranking balances star ratings with review counts; fast-food, convenience stores and places marked as not offering dine-in are excluded.
Housing mix uses residential property records, including homes that are not for sale. Market prices use the most recent recorded qualifying sale per property within 2025-10-15 to 2026-10-15. Transfers identified as non-market transactions and records without a positive sale amount are excluded. Medians appear with at least 10 sales; price per square foot also requires a recorded home size. Property classifications and neighborhood definitions may differ from local usage. These are dated snapshots, not a complete transaction history or live inventory feed.
School grades are FastExpert estimates based on the mean available ratings for unique public schools found across 4 Lower Bottoms property samples: A = 8–10, B = 6–under 8, C = 4–under 6, D = 2–under 4, F = 1–under 2. Unrated schools are excluded. Grades do not confirm attendance eligibility.
Oakland demographics come from the existing FastExpert city-data source. The city’s source year was not supplied. Top agents use FastExpert’s existing Oakland ranking; a Lower Bottoms-specific ranking is not available yet.